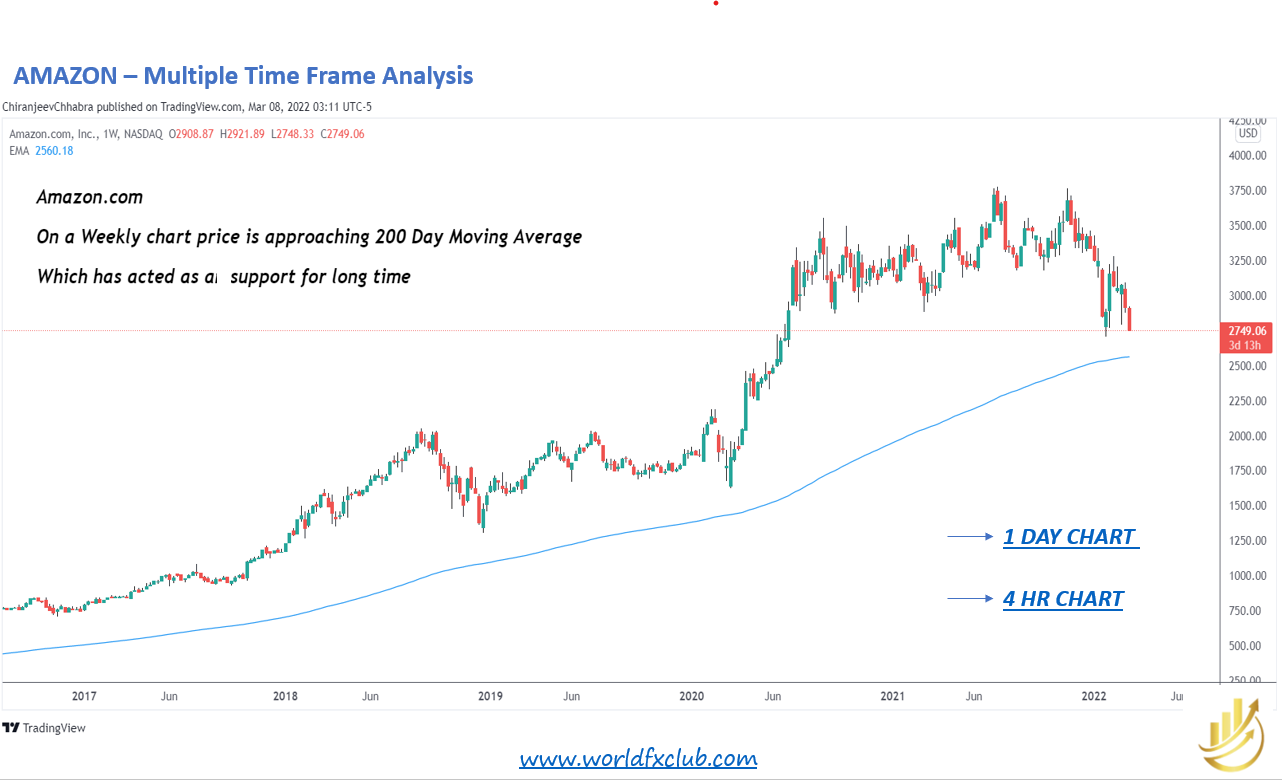
Have a look at the Amazon Multiple Time frame analysis It looks like a good buy for long term Download the guide below Amazon – Wfxclub
Explore MoreHave a look at the Amazon Multiple Time frame analysis It looks like a good buy for long term Download the guide below Amazon – Wfxclub
Explore More
More uncertainty in the world will lead the price to go higher. Russian people are facing monetary issues ATM withdrawals are limited The ruble dropped 30% Russians are buying Bitcoin Here is the Bitcoin chart at a daily time frame indicating the downtrend line is broken Now let’s see how bullish scenario looks like Also […]
Explore More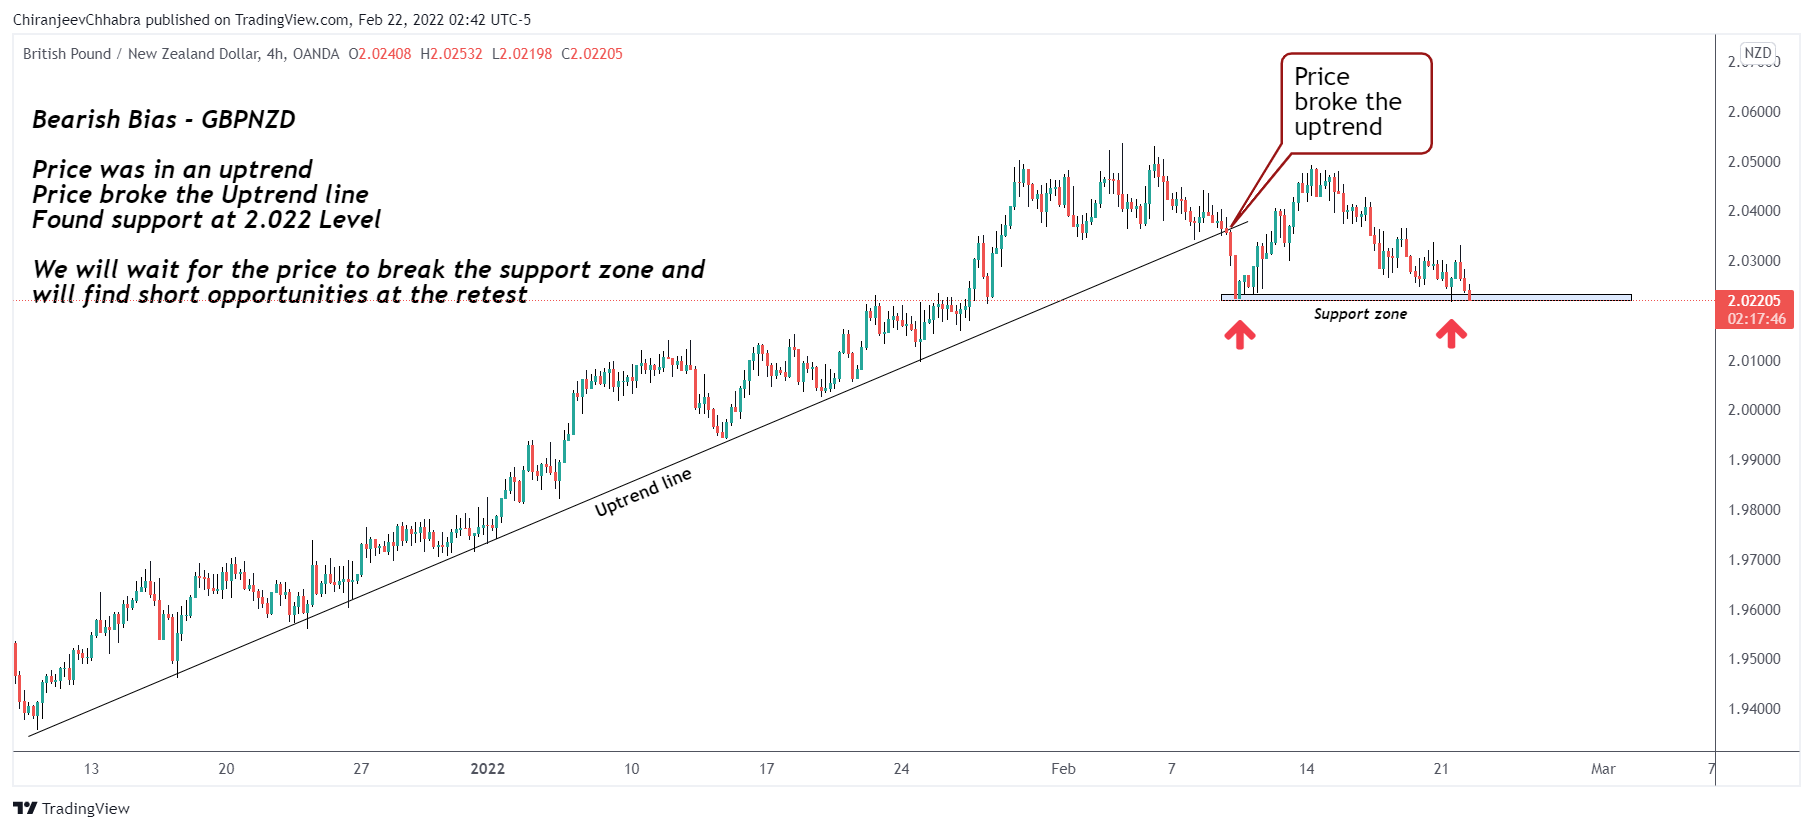
Price is actually at support at 4 Hr We have to wait a bit to see if we break below the zone Here is 15 Min chart Register with us and learn how to trade Open an account and contact us – we offer intensive training programs Here is the link OPEN AN ACCOUNT
Explore More
Here are some Favourite US stocks 1. Coinbase Global, Inc., branded Coinbase, is an American company that operates a cryptocurrency exchange platform. Coinbase operates remote-first and lacks an official physical headquarter 2. Pfizer Inc. is an American multinational pharmaceutical and biotechnology corporation headquartered on 42nd Street in Manhattan, New York City. The company was established […]
Explore More
Look at the chart below for a 4 Hr setup MULTIPLE REASONS FOR BUYING 1. Break of the Downtrend line – Bullish 2. Looks like inverse head shoulder – Bullish Register with us and learn how to trade Open an account and contact us – we offer intensive training programs Here is the link OPEN […]
Explore MoreA plain chart of Bitcoin – hr time frame looks like this Now see the below 3 charts which will tell you different ways of analyzing trends and changes in trend Drawing Key Support and Resistance zone Drawing Trend lines Drawing Moving Average By Drawing Key Support and resistance zones By Drawing Trend […]
Explore More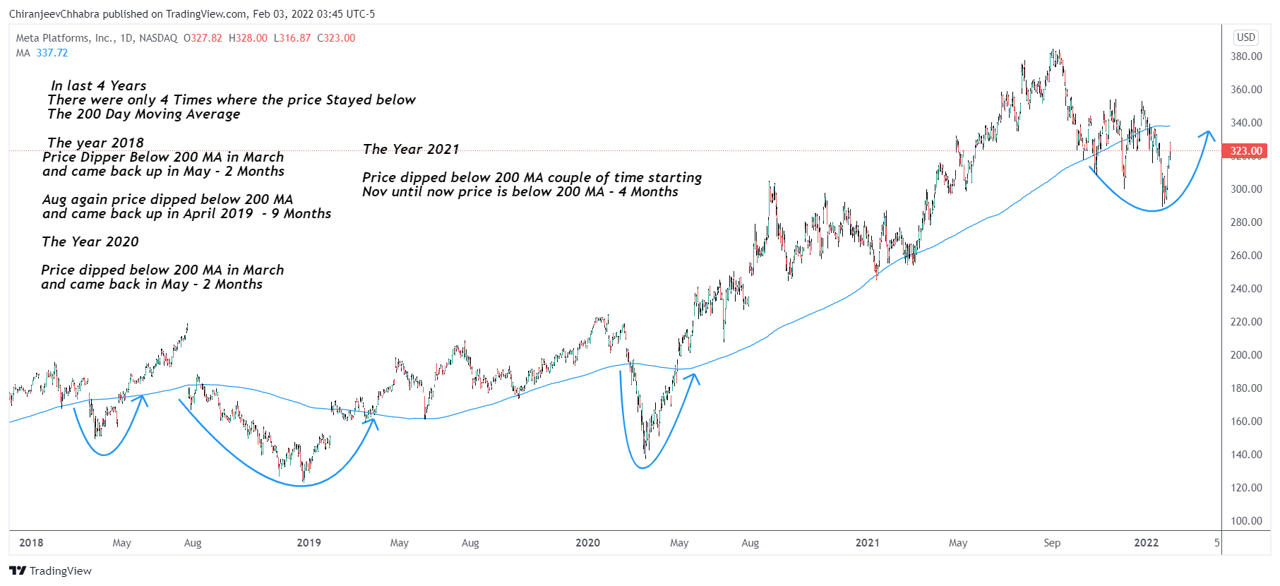
Meta Platforms, Inc., doing business as Meta and formerly known as Facebook, Inc., is an American multinational technology conglomerate based in Menlo Park, California. The company is the parent organization of Facebook, Instagram, and WhatsApp Let’s look at 4 HR chart to find trading opportunities What is your opinion? Price will break the resistance and […]
Explore More
Something very interesting i found on swan I have tried to summarize some part of the book Download the Bitcoin Guide here What Bitcoin Taught me PDF
Explore More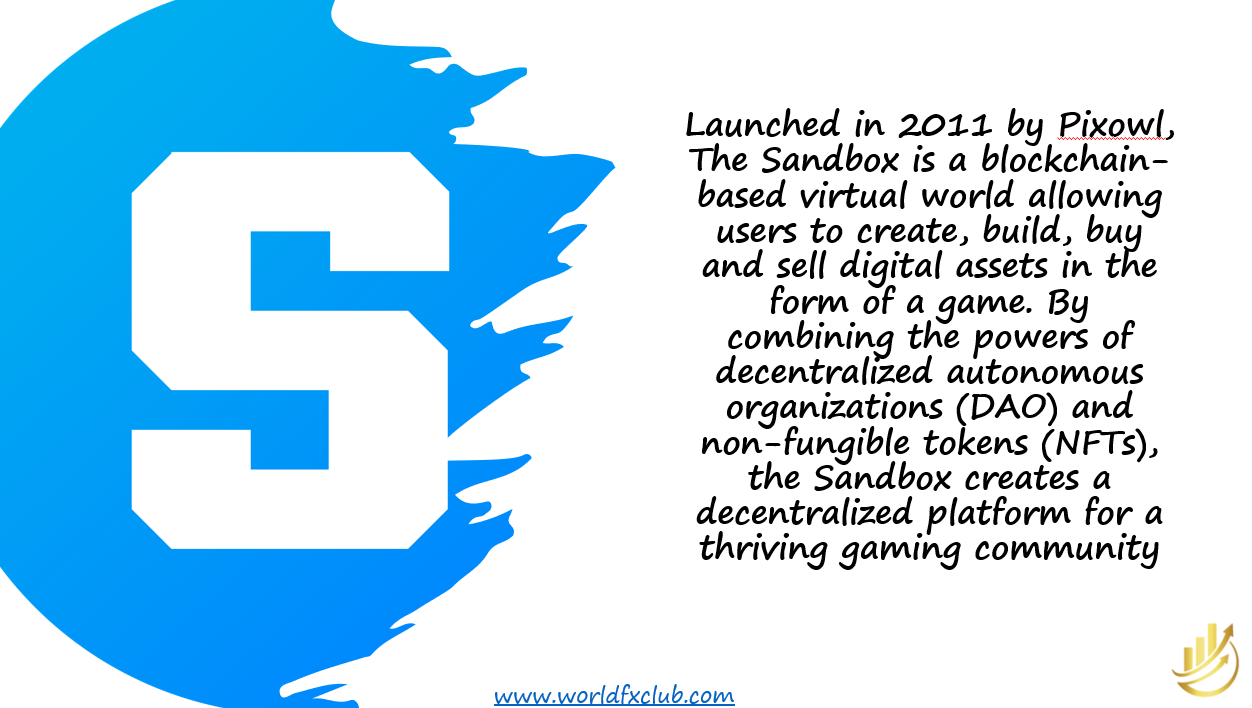
Launched in 2011 by Pixowl, The Sandbox is a blockchain-based virtual world allowing users to create, build, buy and sell digital assets in the form of a game. By combining the powers of decentralized autonomous organizations (DAO) and non-fungible tokens (NFTs), the Sandbox creates a decentralized platform for a thriving gaming community. According to the official whitepaper, […]
Explore More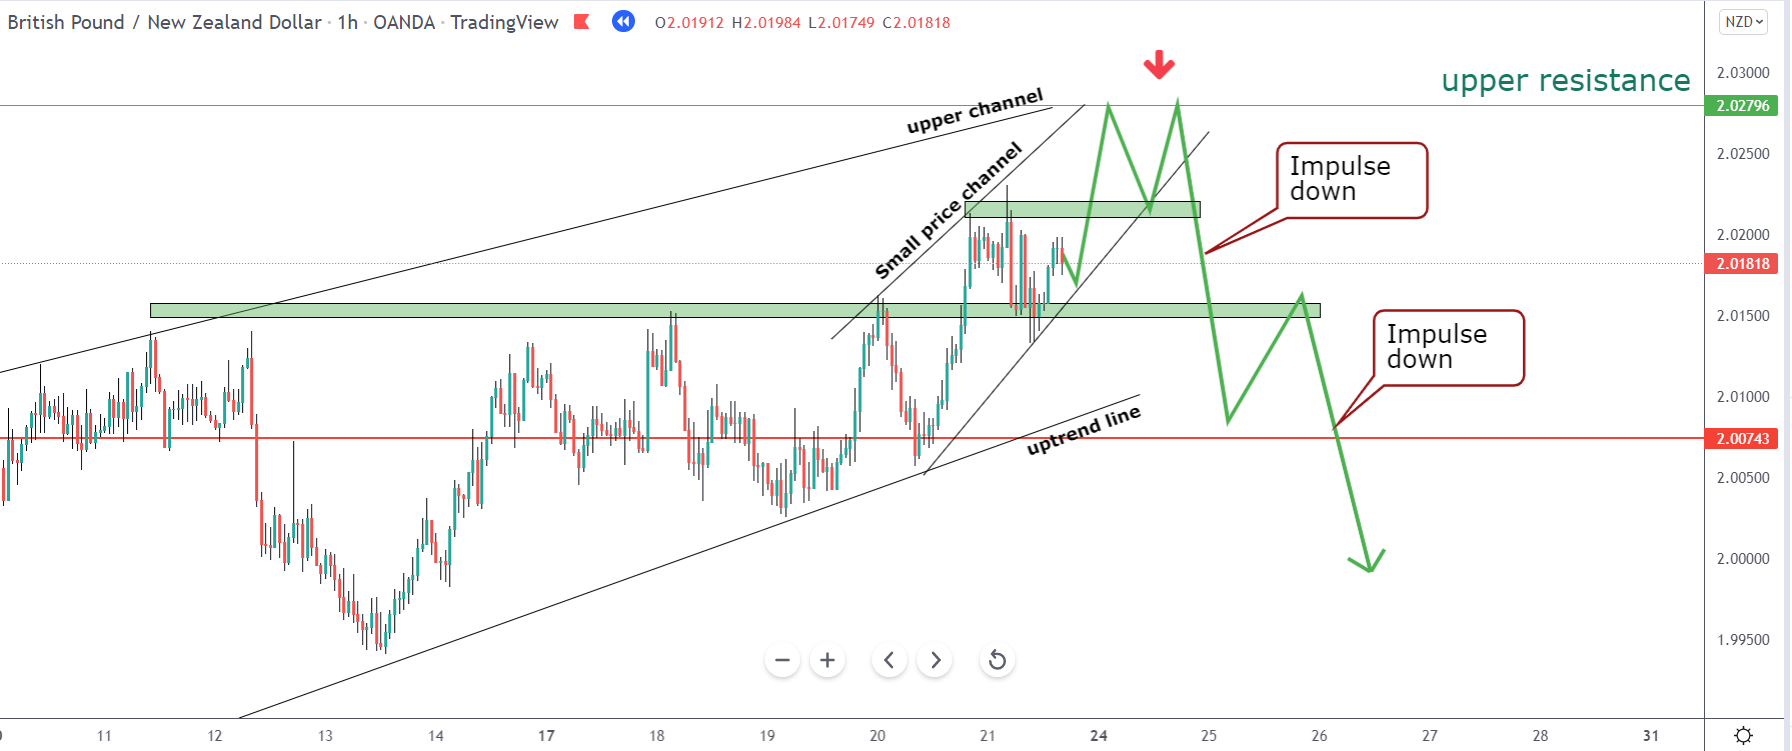
Download a full guide on how beginners sell and see their emotions alongside GBPNZD trade analysis and setup
Explore More