Technical Analysis
Bitcoin / U.S. Dollar, 10-minute chart
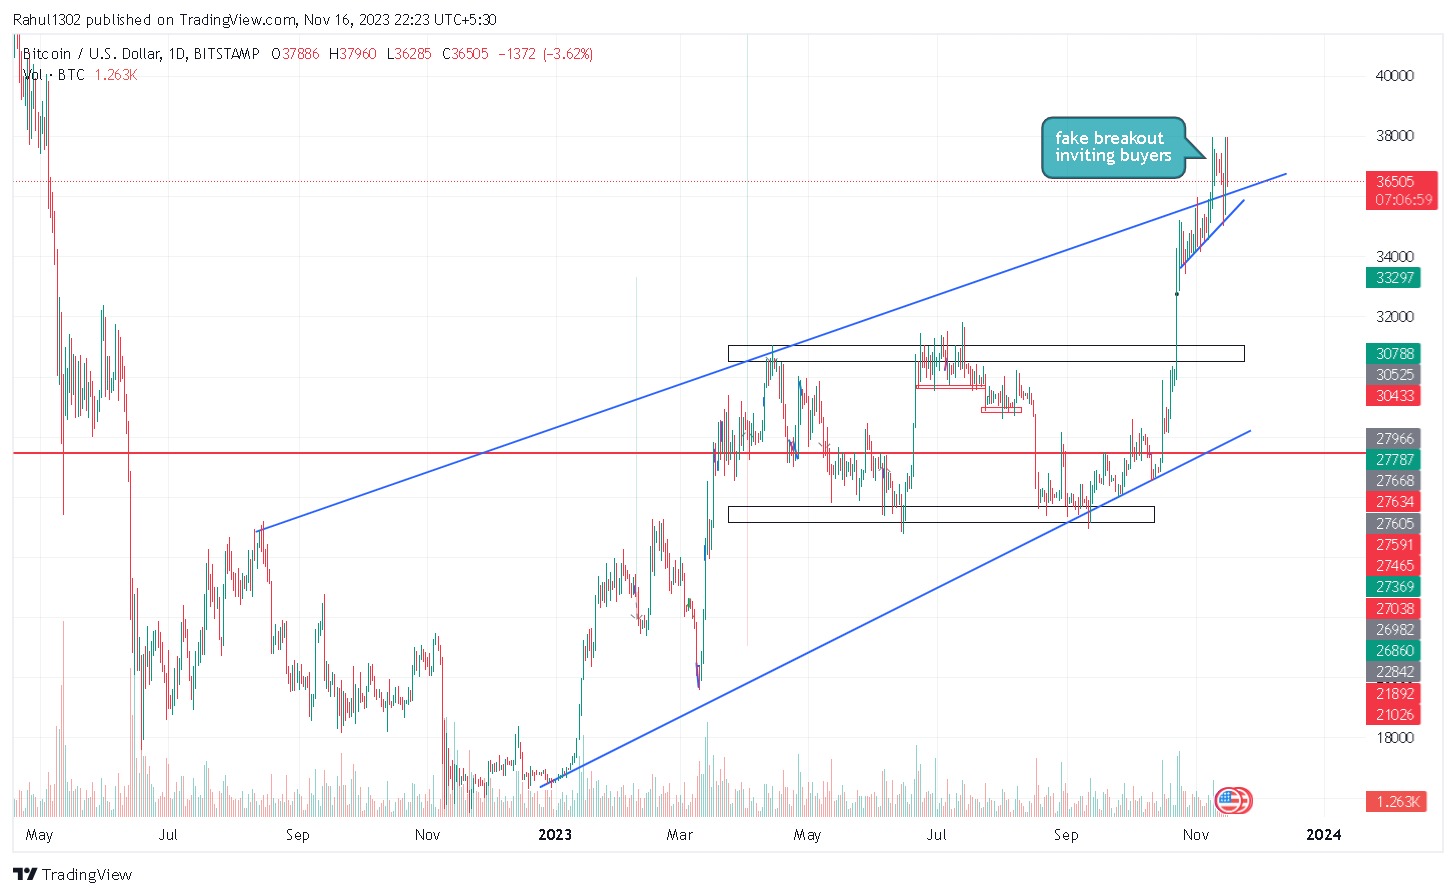
Current price: $36,505
Overall trend: Mixed
Key levels:
Support: $34,000
Resistance: $38,000
Analysis:
Bitcoin has been in a downtrend since early November 2023. The recent fake breakout at $38,000 was a trap to invite buyers, and the price has since fallen back to $36,505.
The current price level is at a key support level of $36,505. If this level breaks down, we could see a further decline to $34,000.
On the other hand, if the $36,505 level holds, we could see a rebound to $38,000. However, this rebound is likely to be short-lived, as the overall trend remains bearish.
SMC (Smart Money Concepts):
SMC is a trading methodology that uses order flow and price action to identify potential reversals and breakouts.
On the current Bitcoin chart, we can see a number of SMC signals that suggest that a further decline is likely. These include:
A lack of demand at the $38,000 resistance level.
A large sell order at the $36,505 support level.
A decrease in volume as the price has fallen.
Future Outlook:
Based on the technical analysis and SMC signals, I believe that Bitcoin is likely to decline further in the near future. The $34,000 support level is the next key level to watch. If this level breaks down, we could see a further decline to $32,000 or even $30,000.
However, it is important to note that all technical analysis is subjective, and there is no guarantee that Bitcoin will decline further. It is always important to do your own research and manage your risk accordingly.
Disclaimer:
I am not a financial advisor, and this is not financial advice. Please do your own research before making any investment decisions.
If you want to learn more about investing and want to book a free session with us WhatsApp us now.