Facebook Amazon Netflix Google Microsoft Apple Nvidia
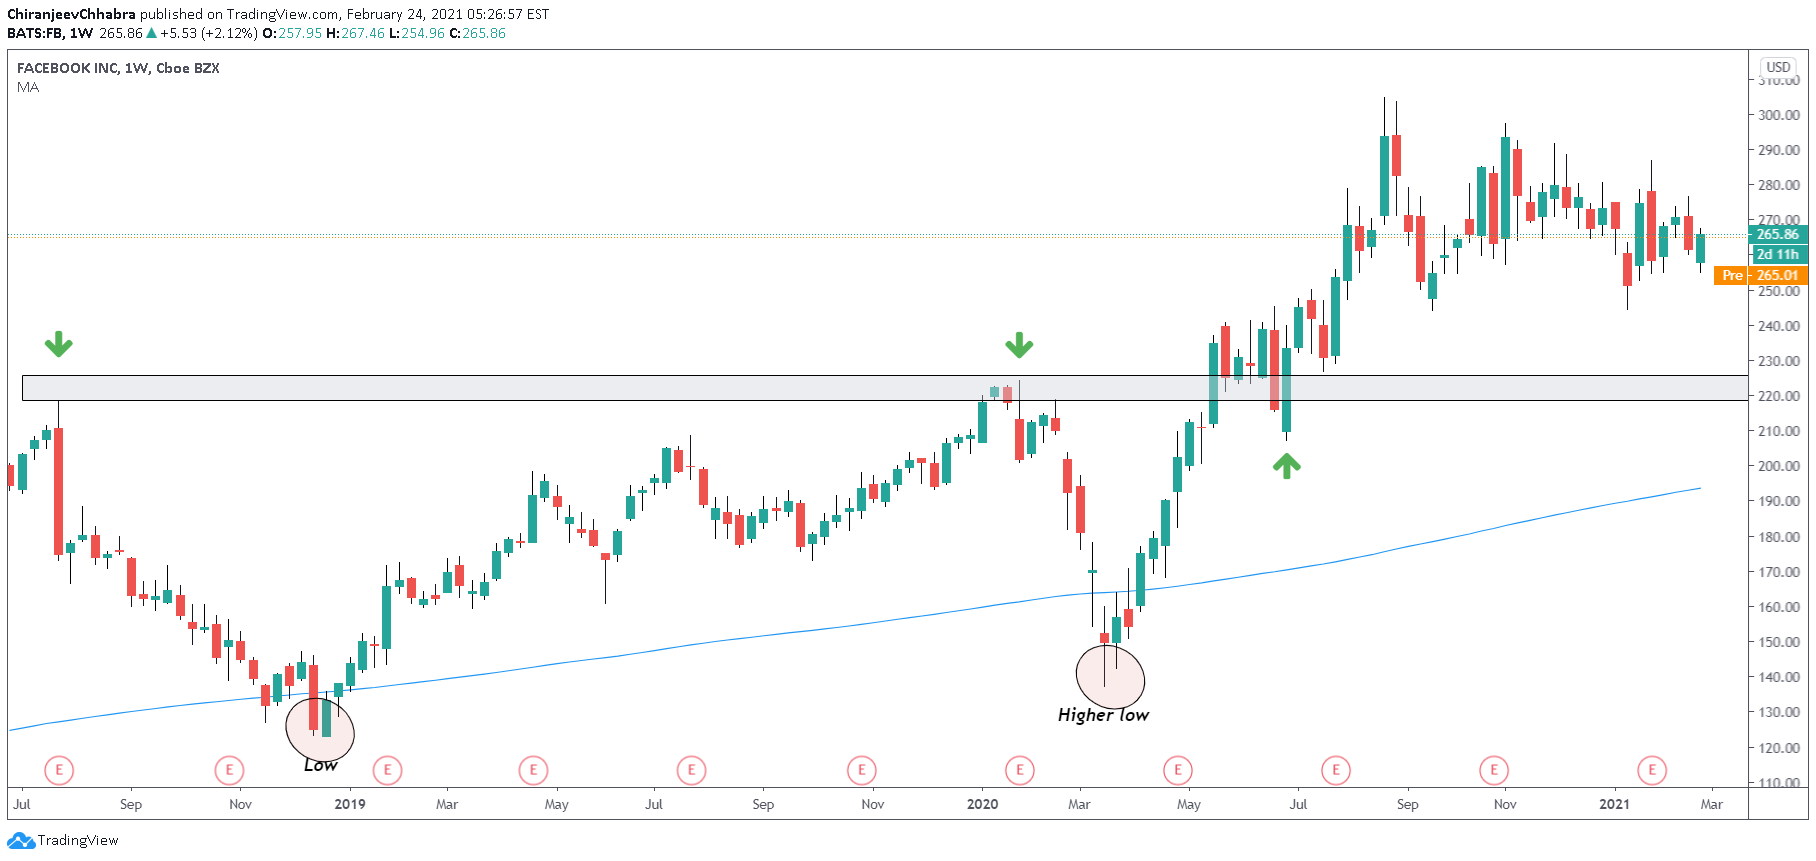
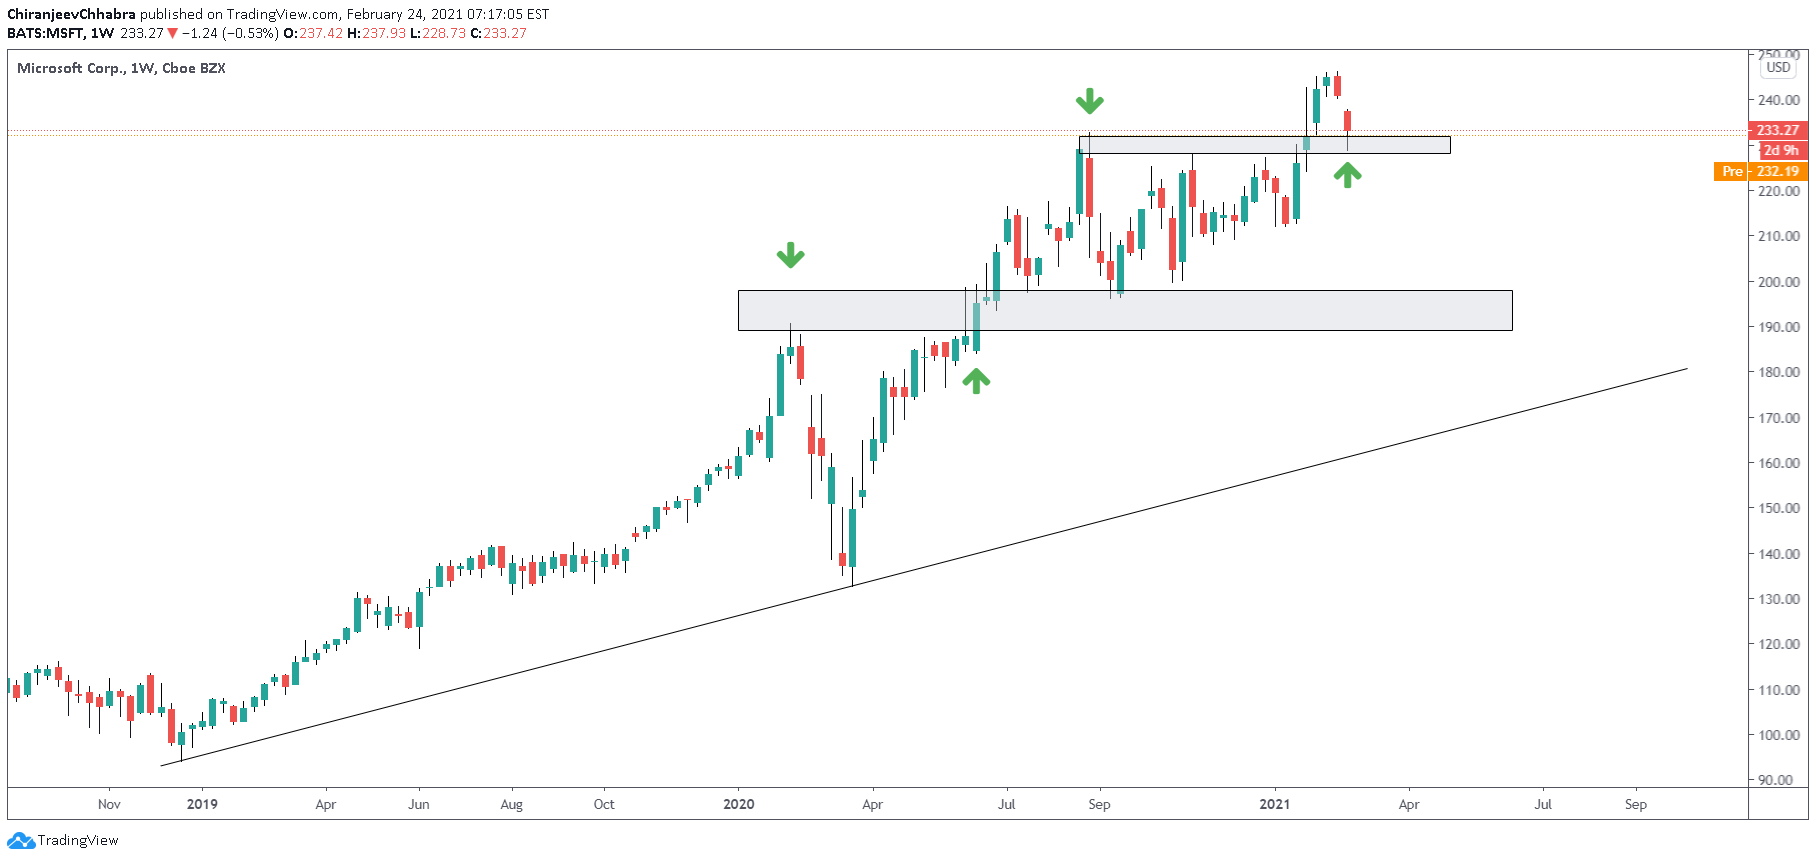
The weekly chart looks overextended – I would be waiting for a price to drop near the breakout zone marked below. Have a look at the daily chart for more clarity
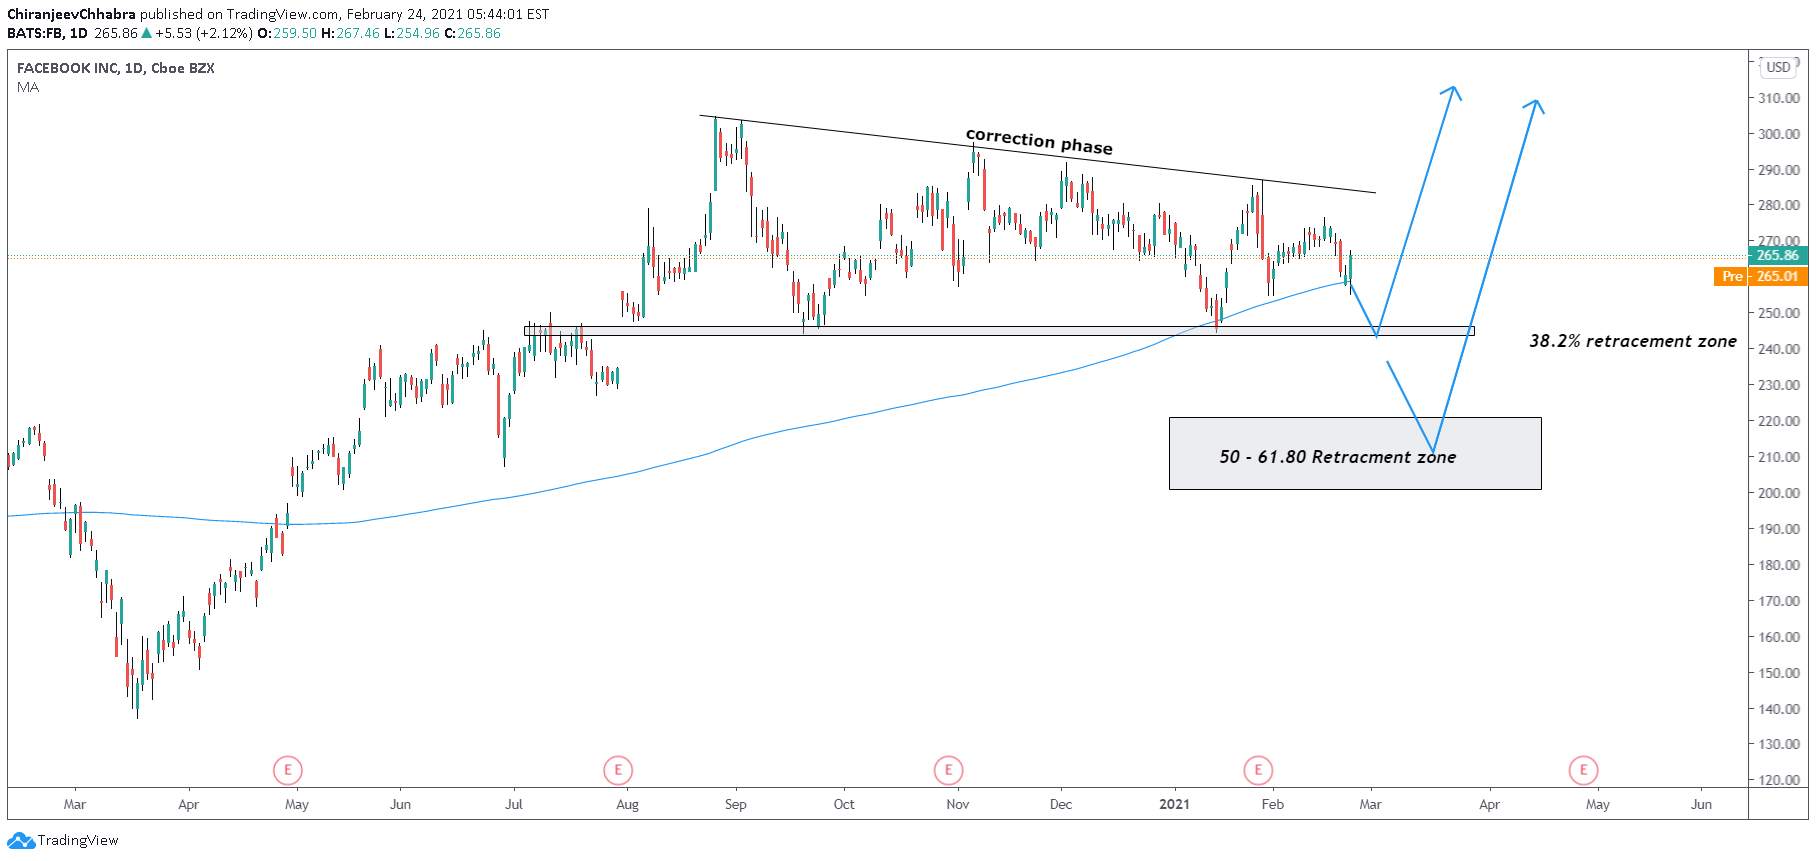
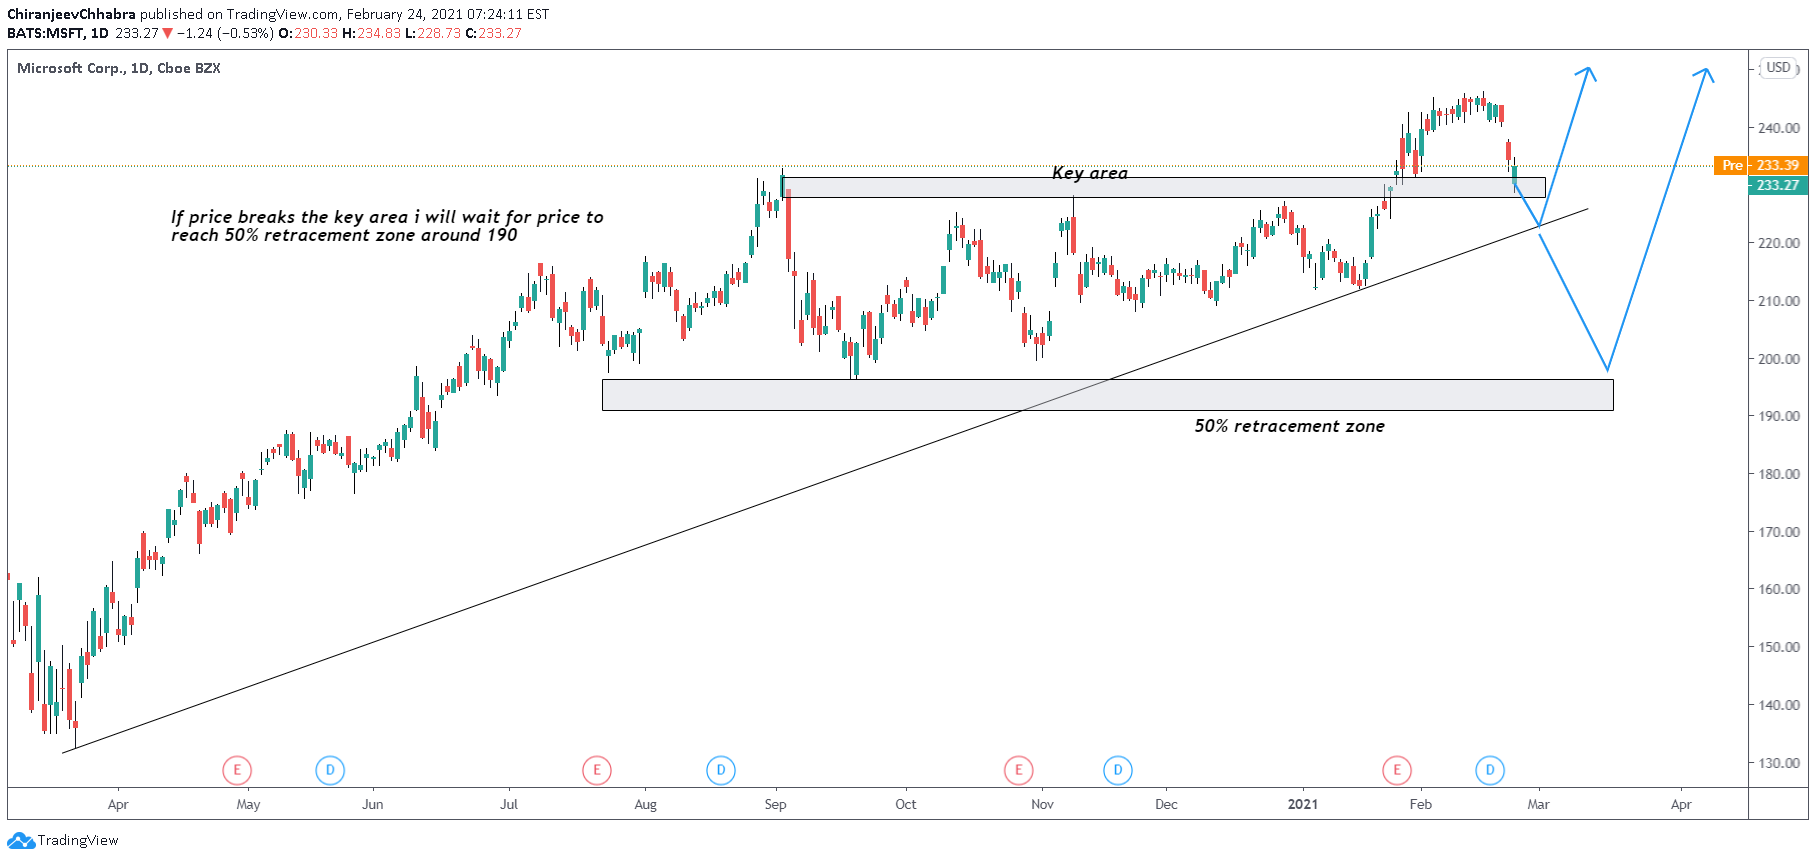
The daily chart below shows that the price is under the correction phase, However, if the price drops to 38.2% retracement zone again it is more likely to break it and head towards 220 – 200 zone
Amazon
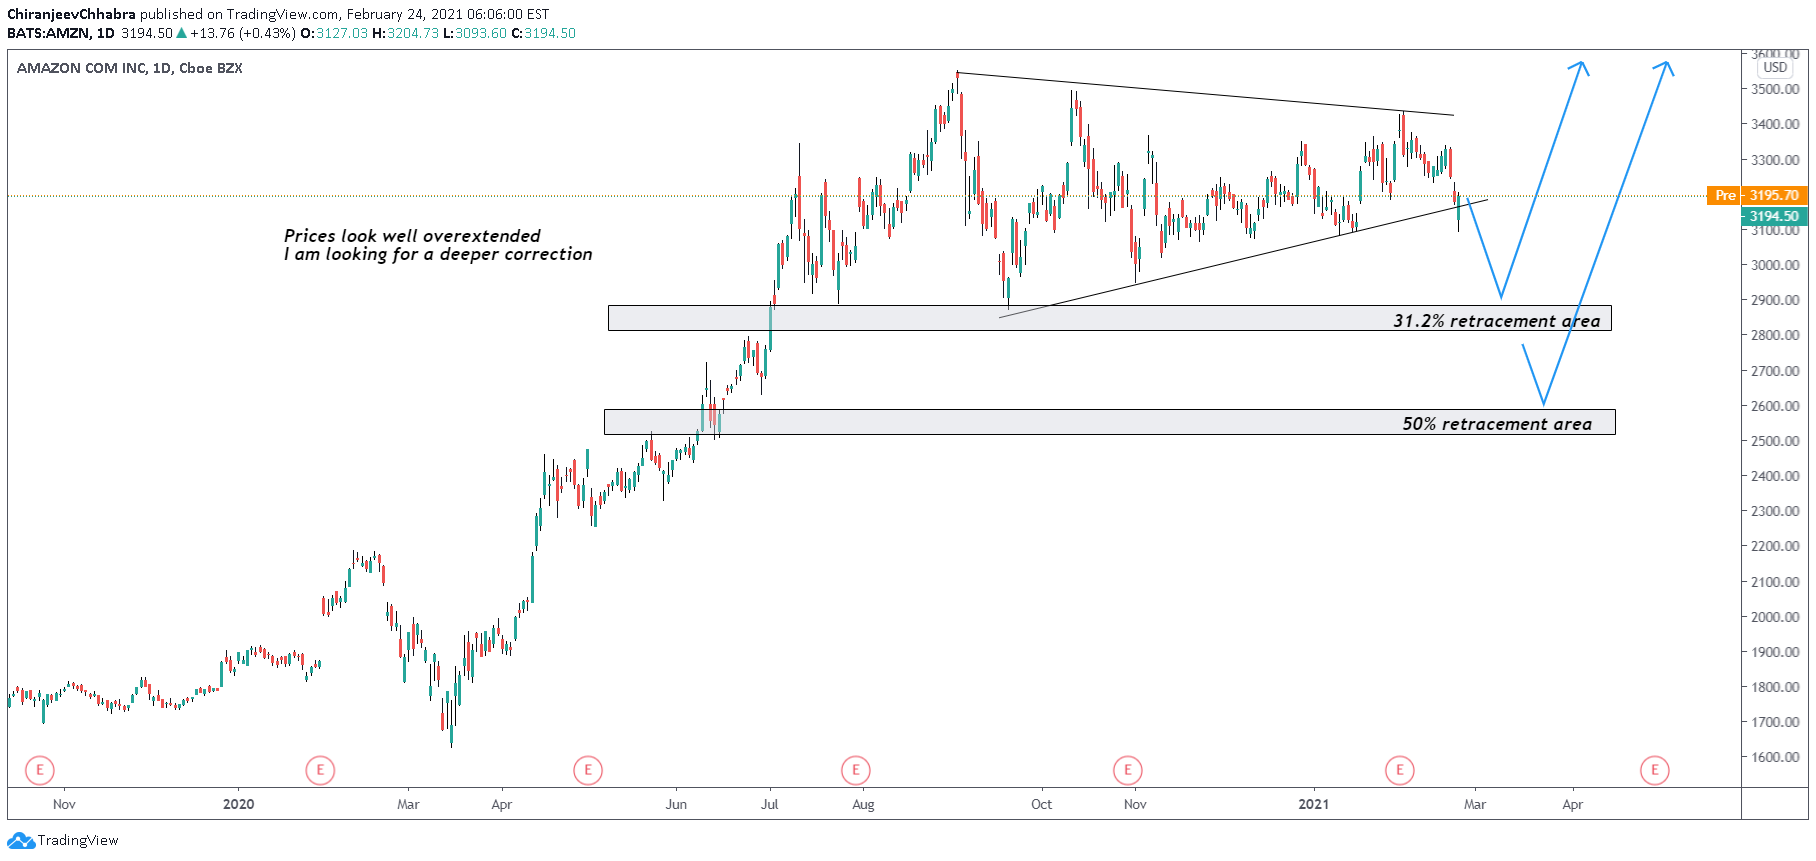
The weekly chart looks overextended, Price is under a triangle pattern, let’s see if it breaks towards the downside
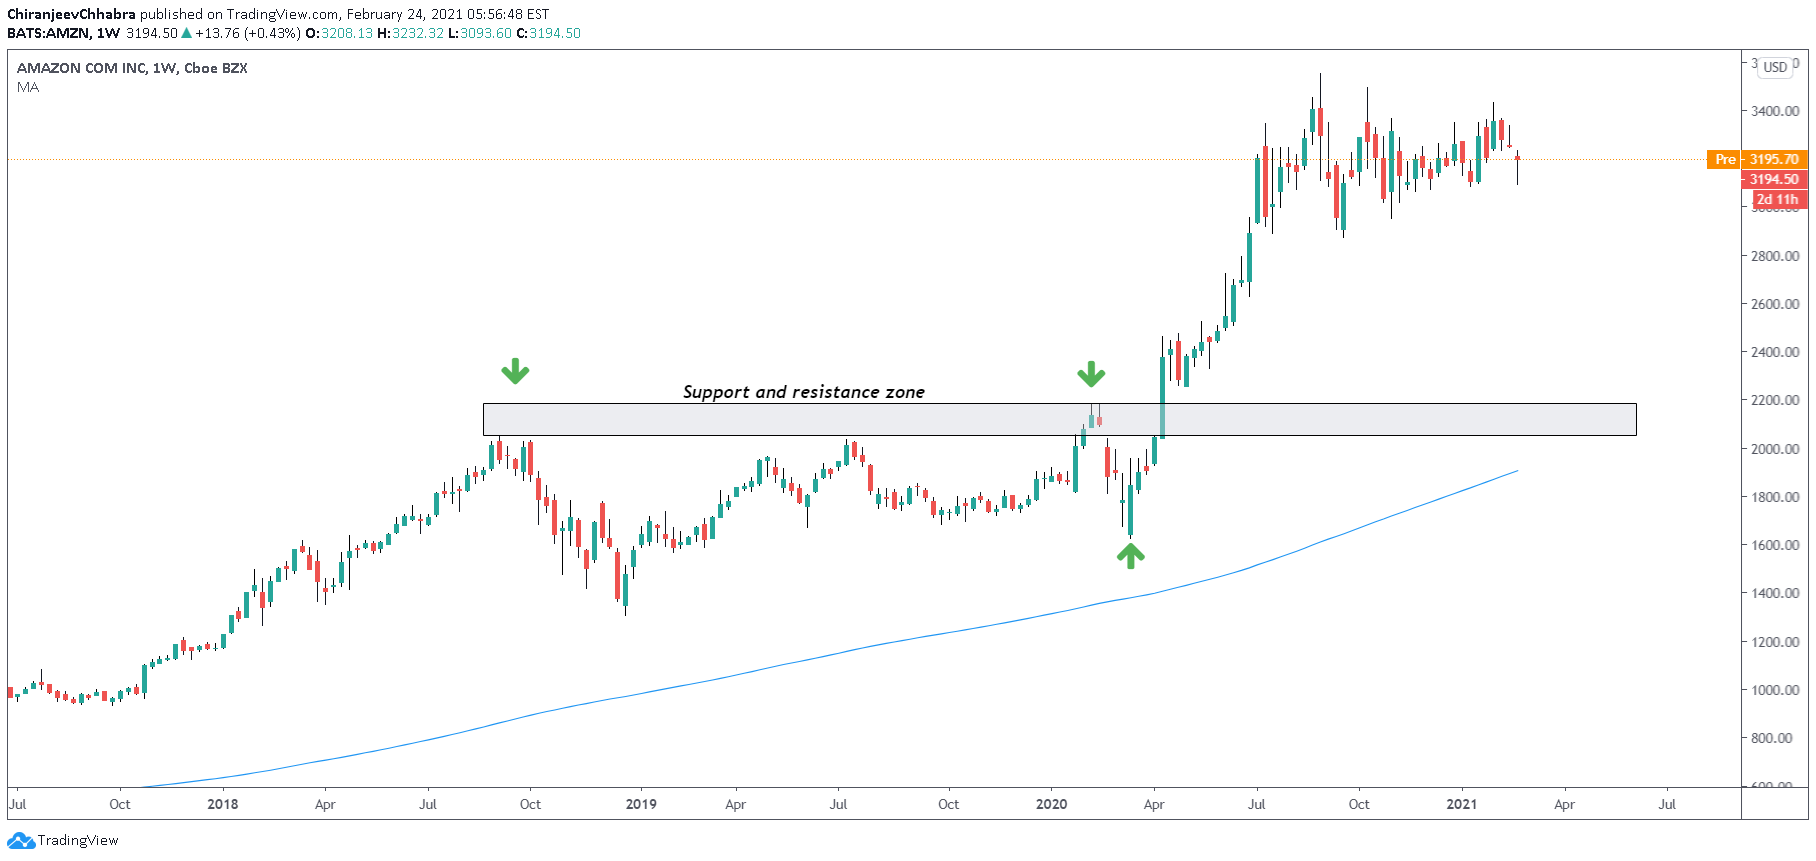
Daily chart – We do not see any clear price action. Most traders are expecting correction however I think it might have a deeper correction if it breaks the 2800 area
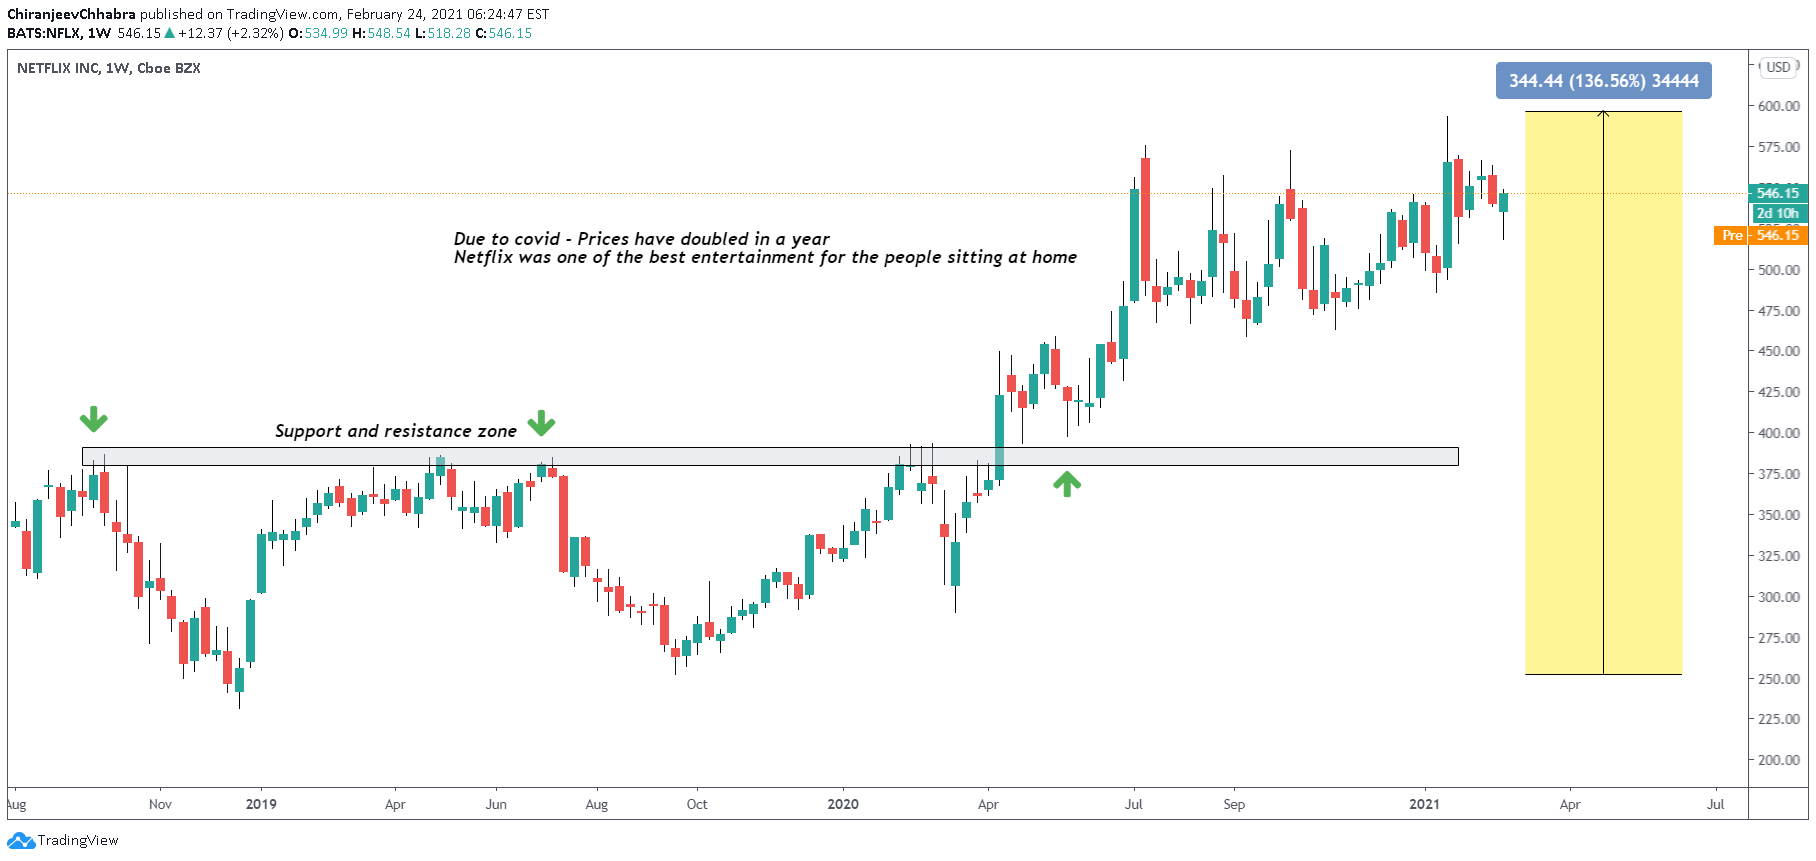
Netflix – Due to covid prices have doubled in a year Netflix was one of the best entertainment for the people sitting at home
look at the weekly and daily charts
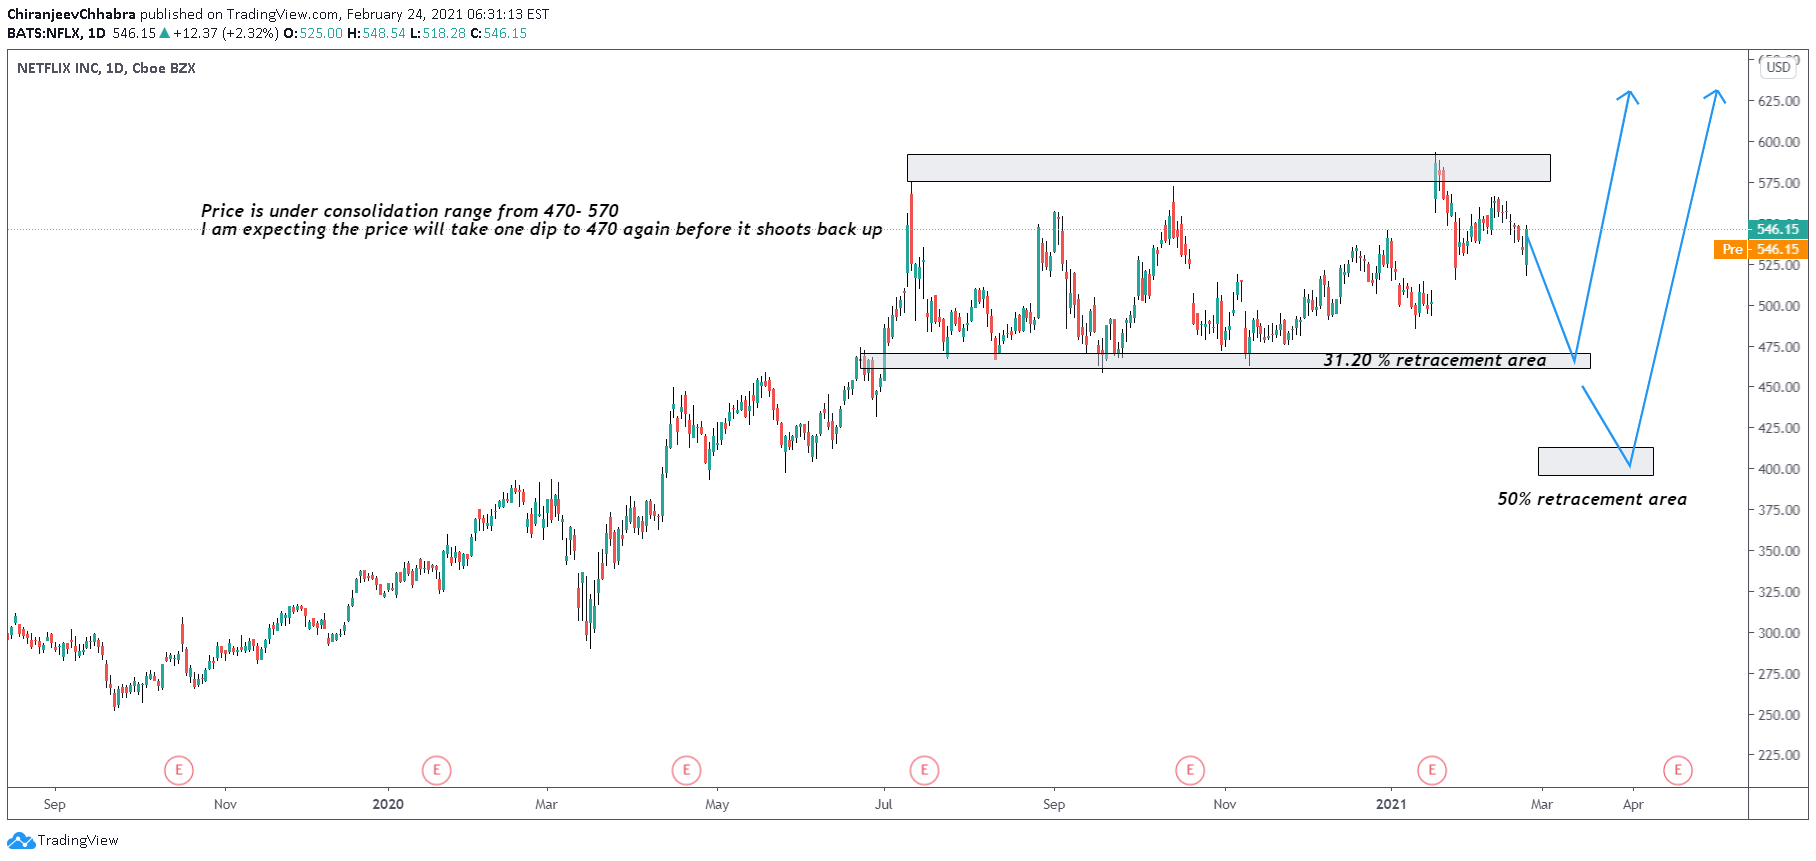
Daily chart
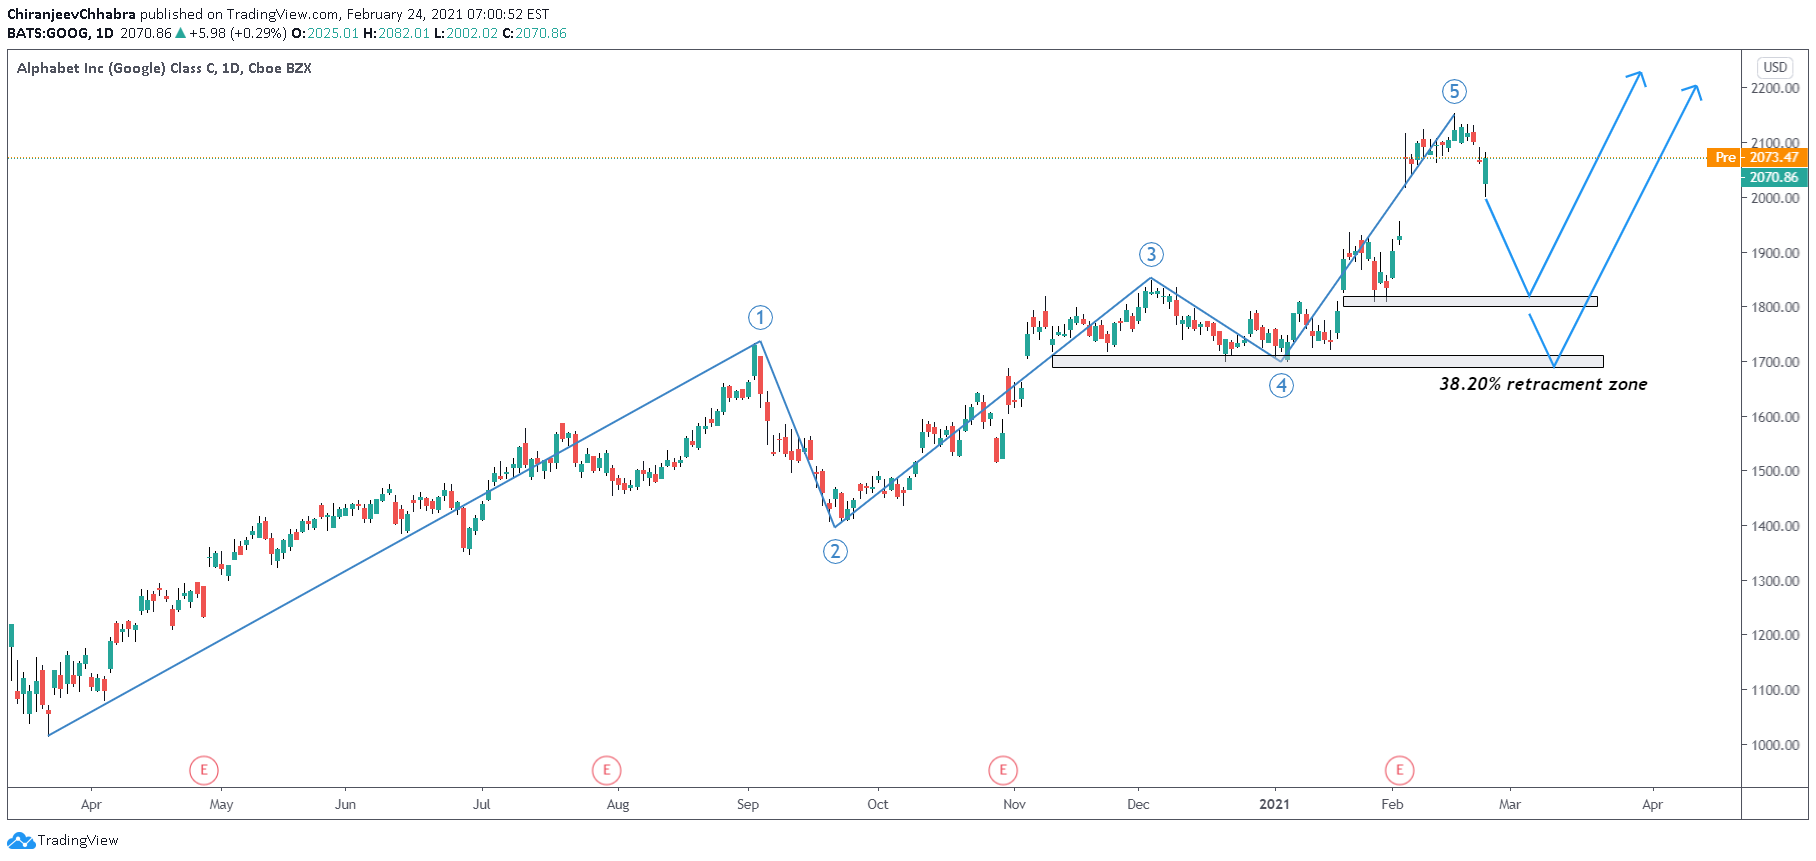
Google – weekly and daily also looks overextended- we might see price getting deeper correction below 2000 area soon
We see a bearish pin bar at the top seems like buyers are dying
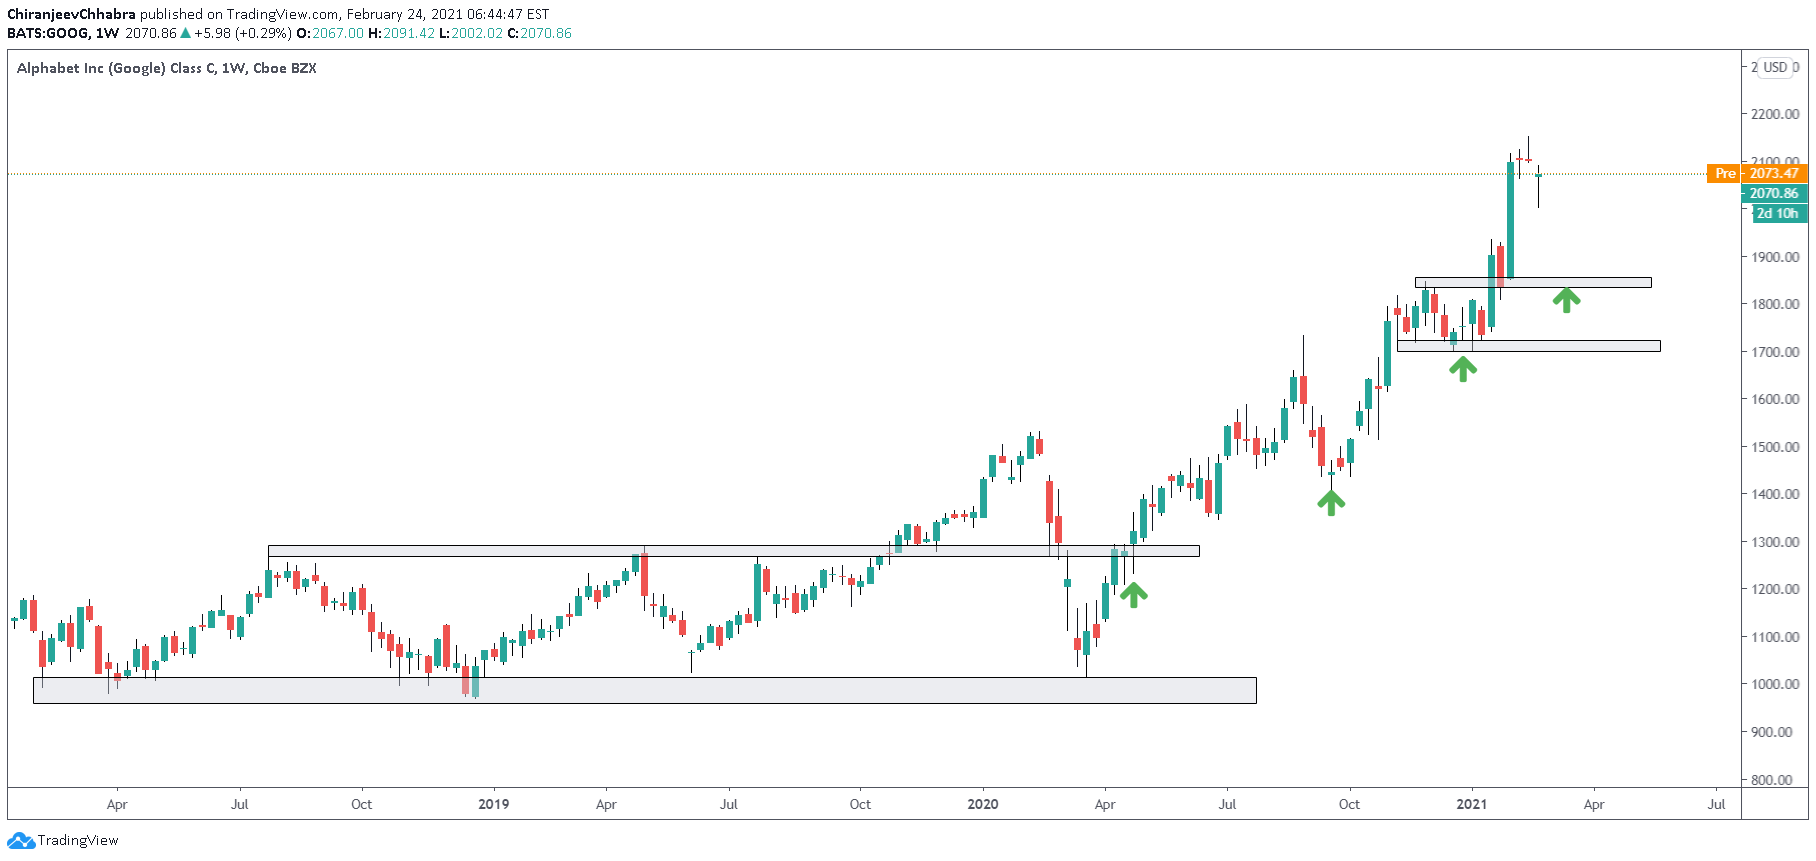 Waves plotted shows that correction is due – Looking to buy google below 1800 zone
Microsoft – One of my favourite stocks to hold
Daily chart
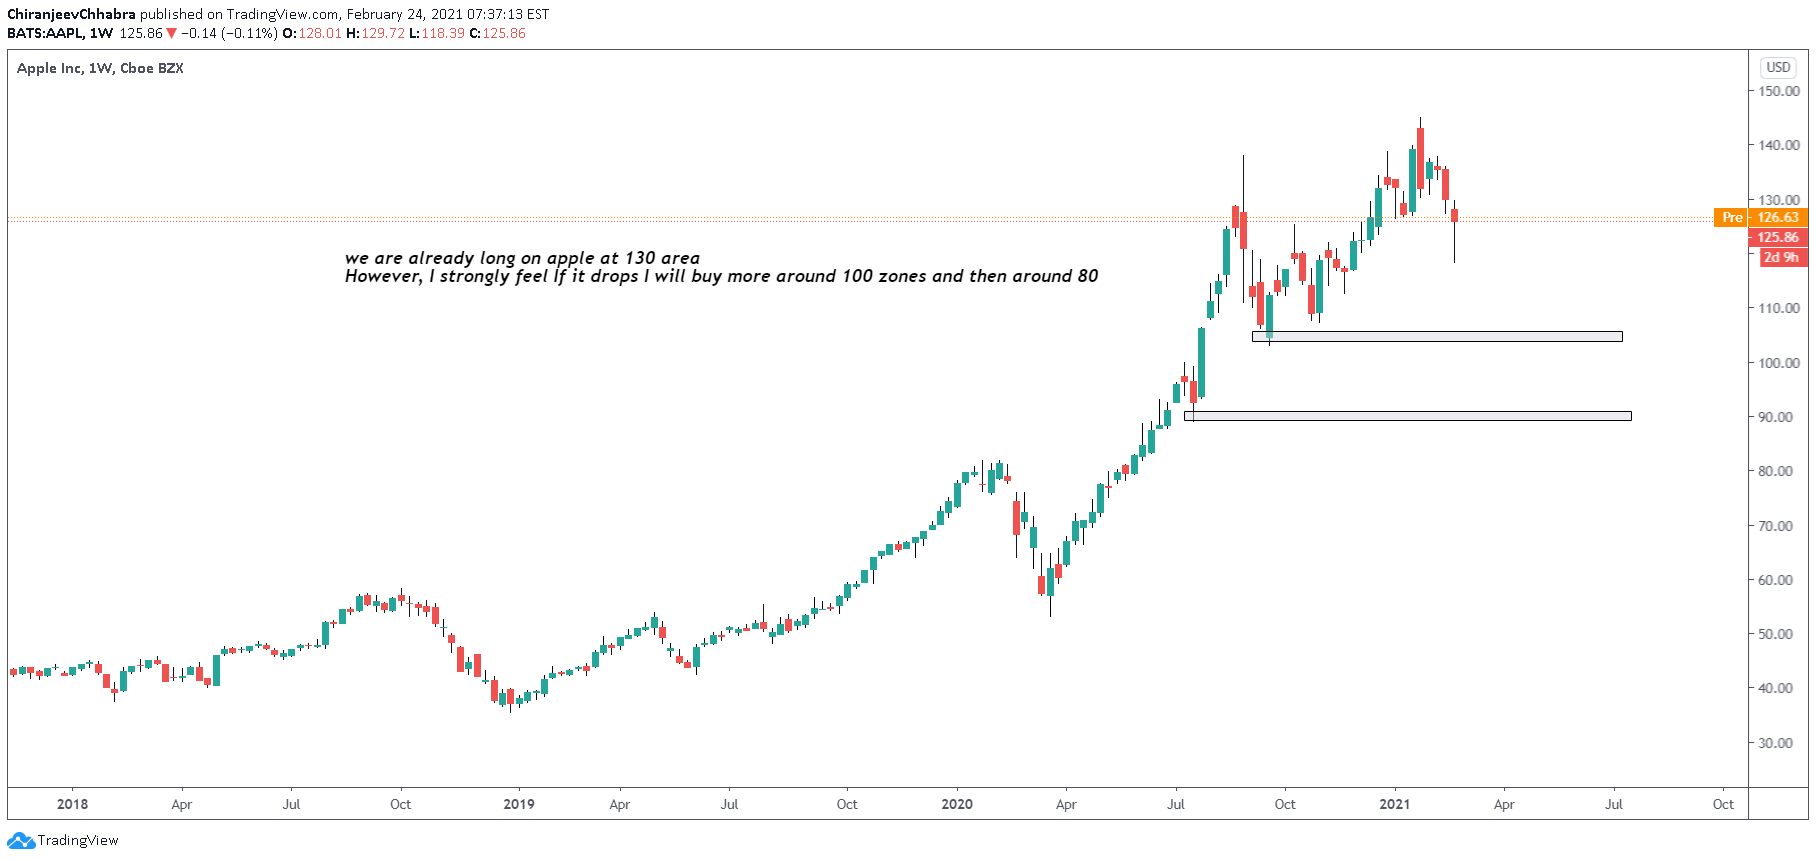
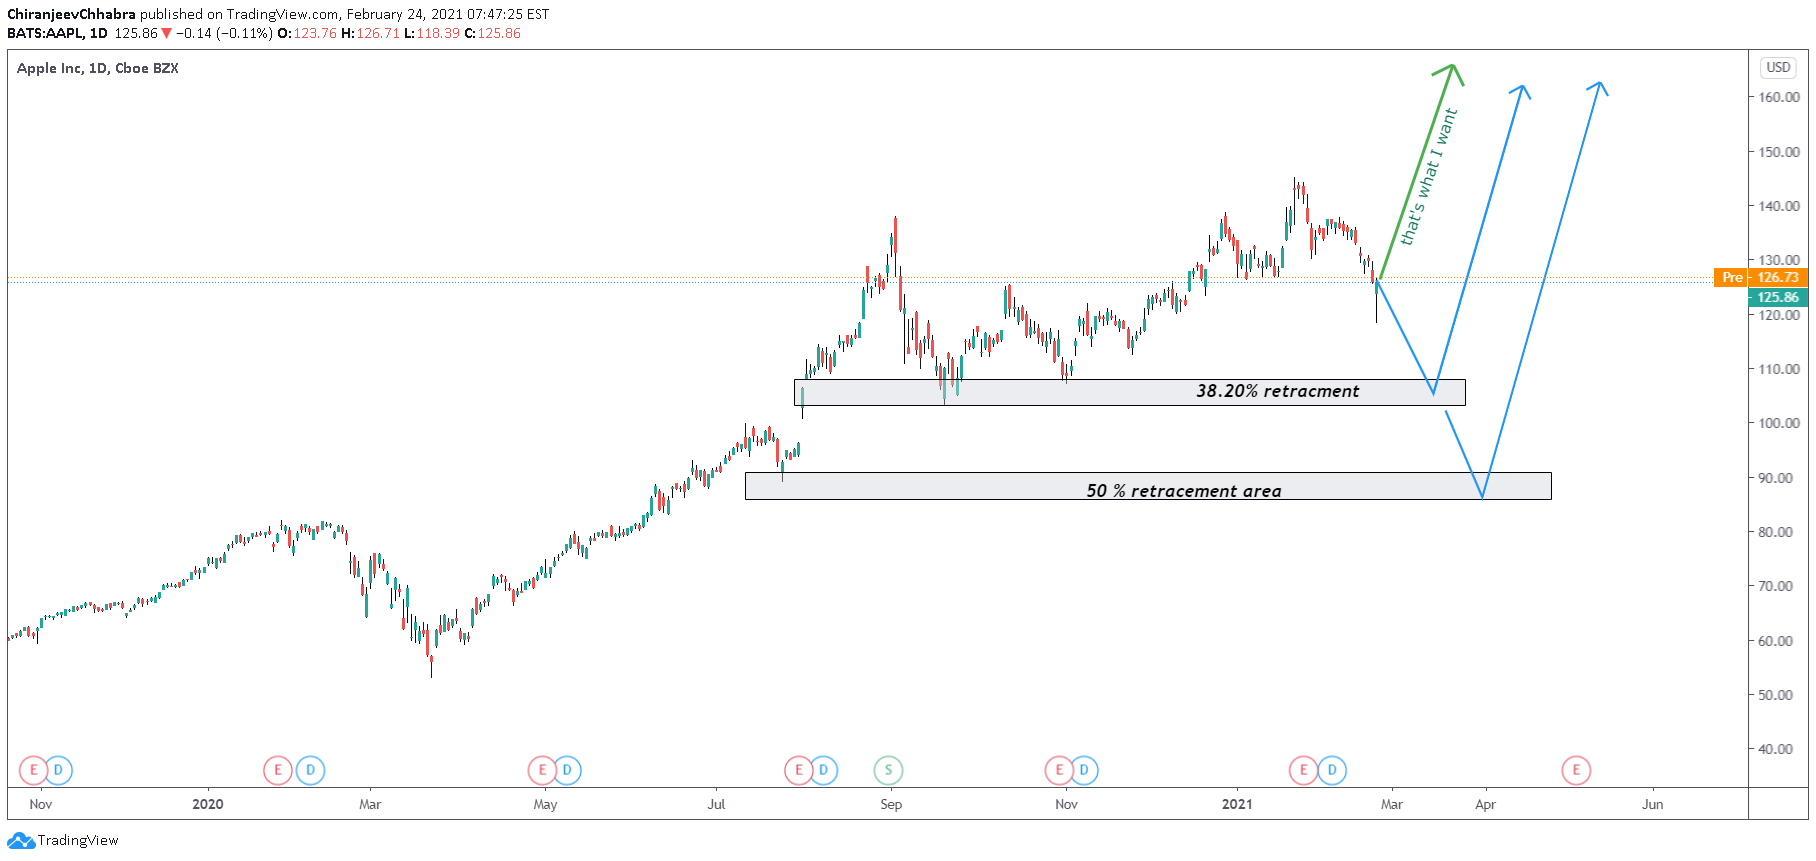
Apple – We are already long on apple at 130 area
Looking to the renter if price drops
Daily chart
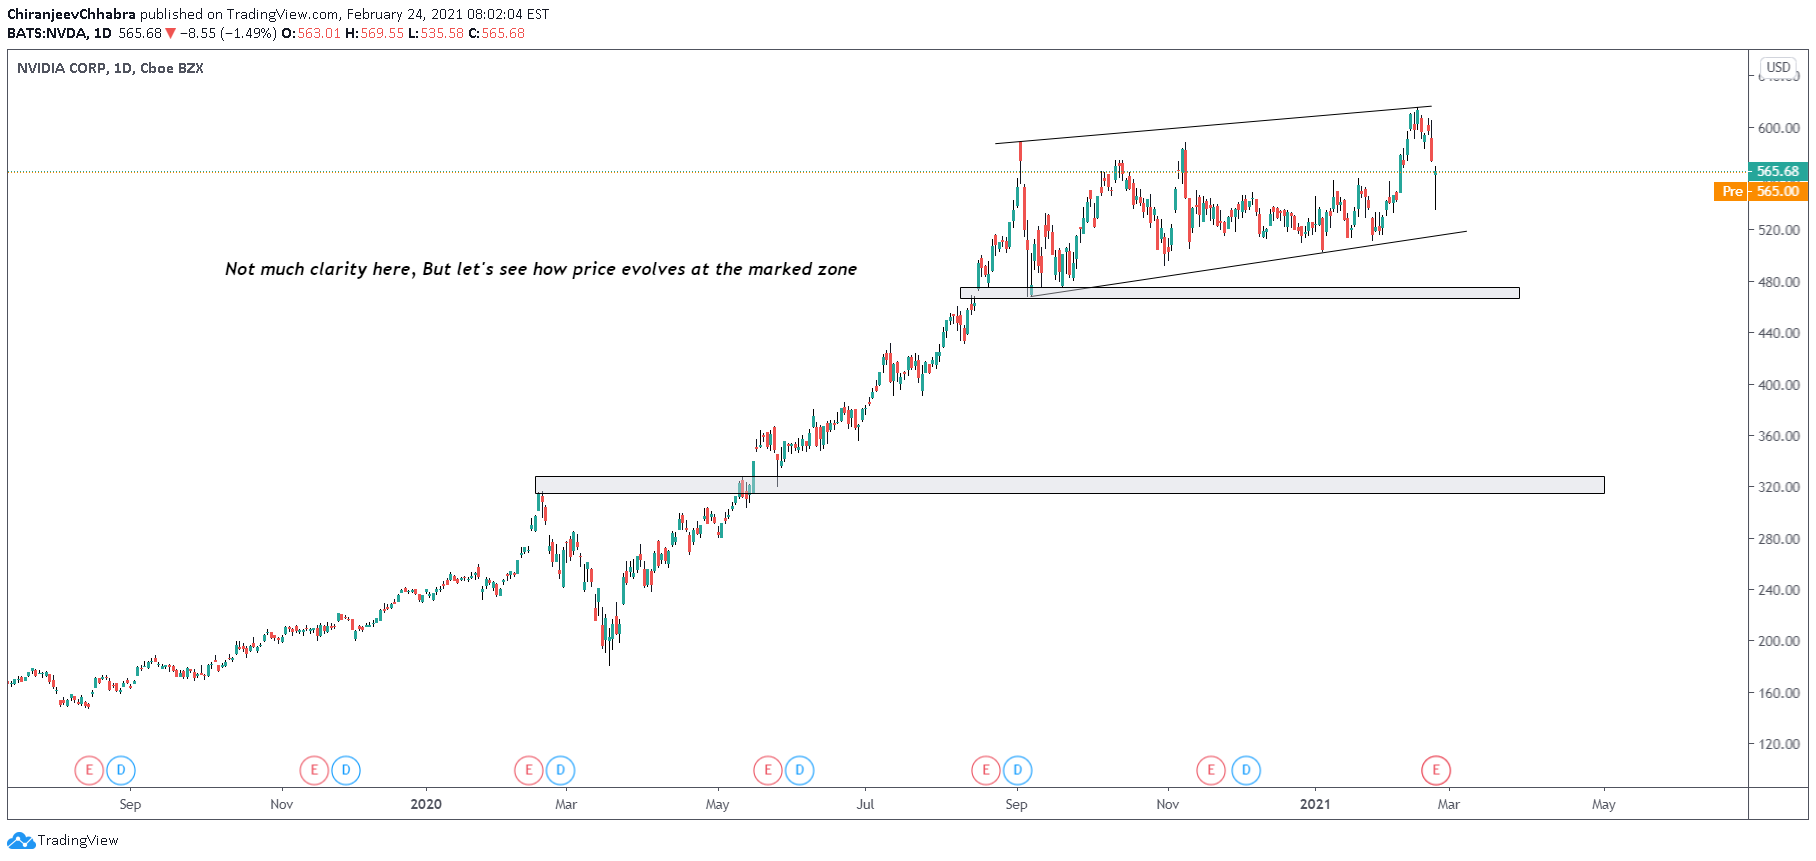
Nvidia – Not much clarity here , But lets see how price reacts at the marked zones below