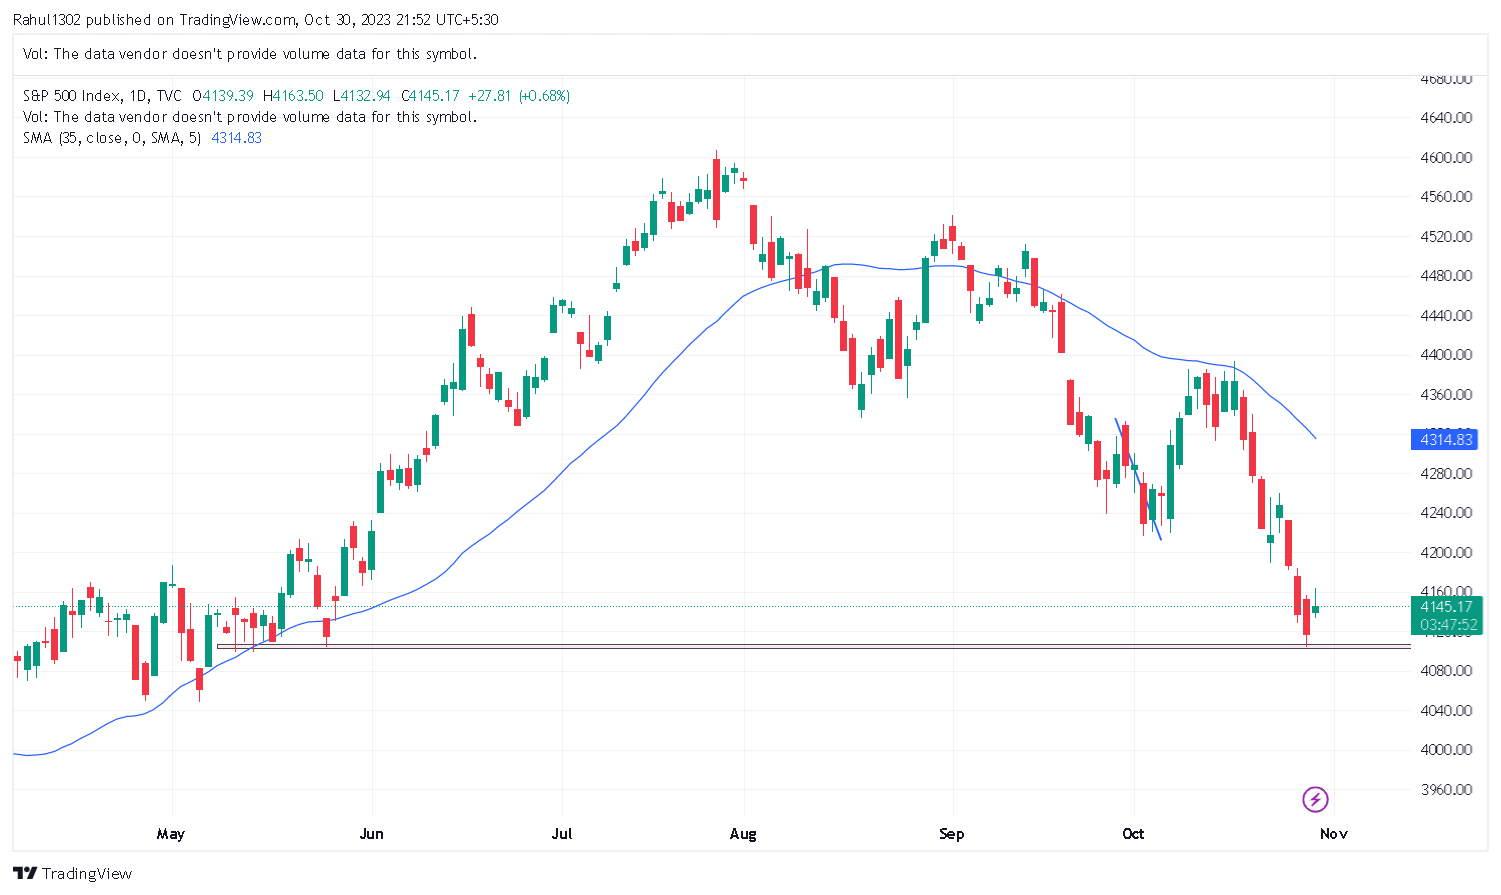
S&P 500 Chart Analysis The S&P 500 has been in a major correction since late August, falling over 10% from its peak. This correction has been driven by a number of factors, including rising interest rates, inflation concerns, and the ongoing war in Ukraine. The chart shows that the S&P 500 has been consolidating in […]
Explore More