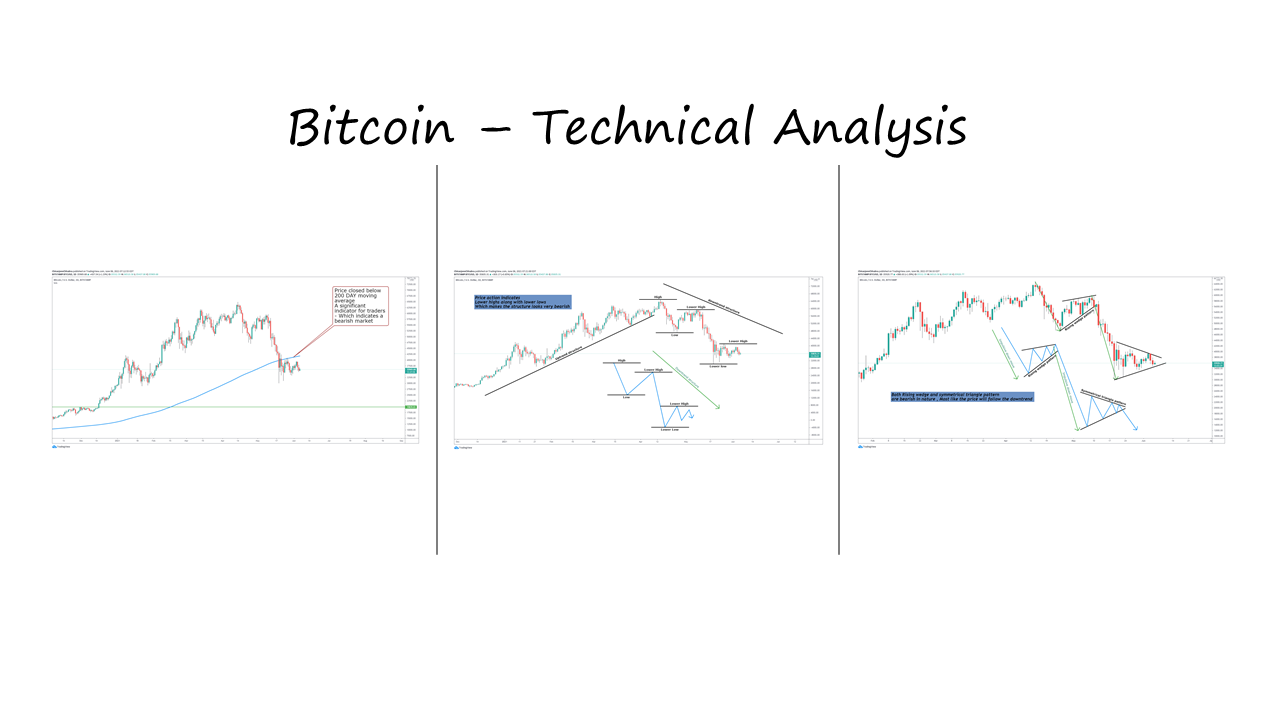
Let’s look at different types of technical analysis on the daily chart
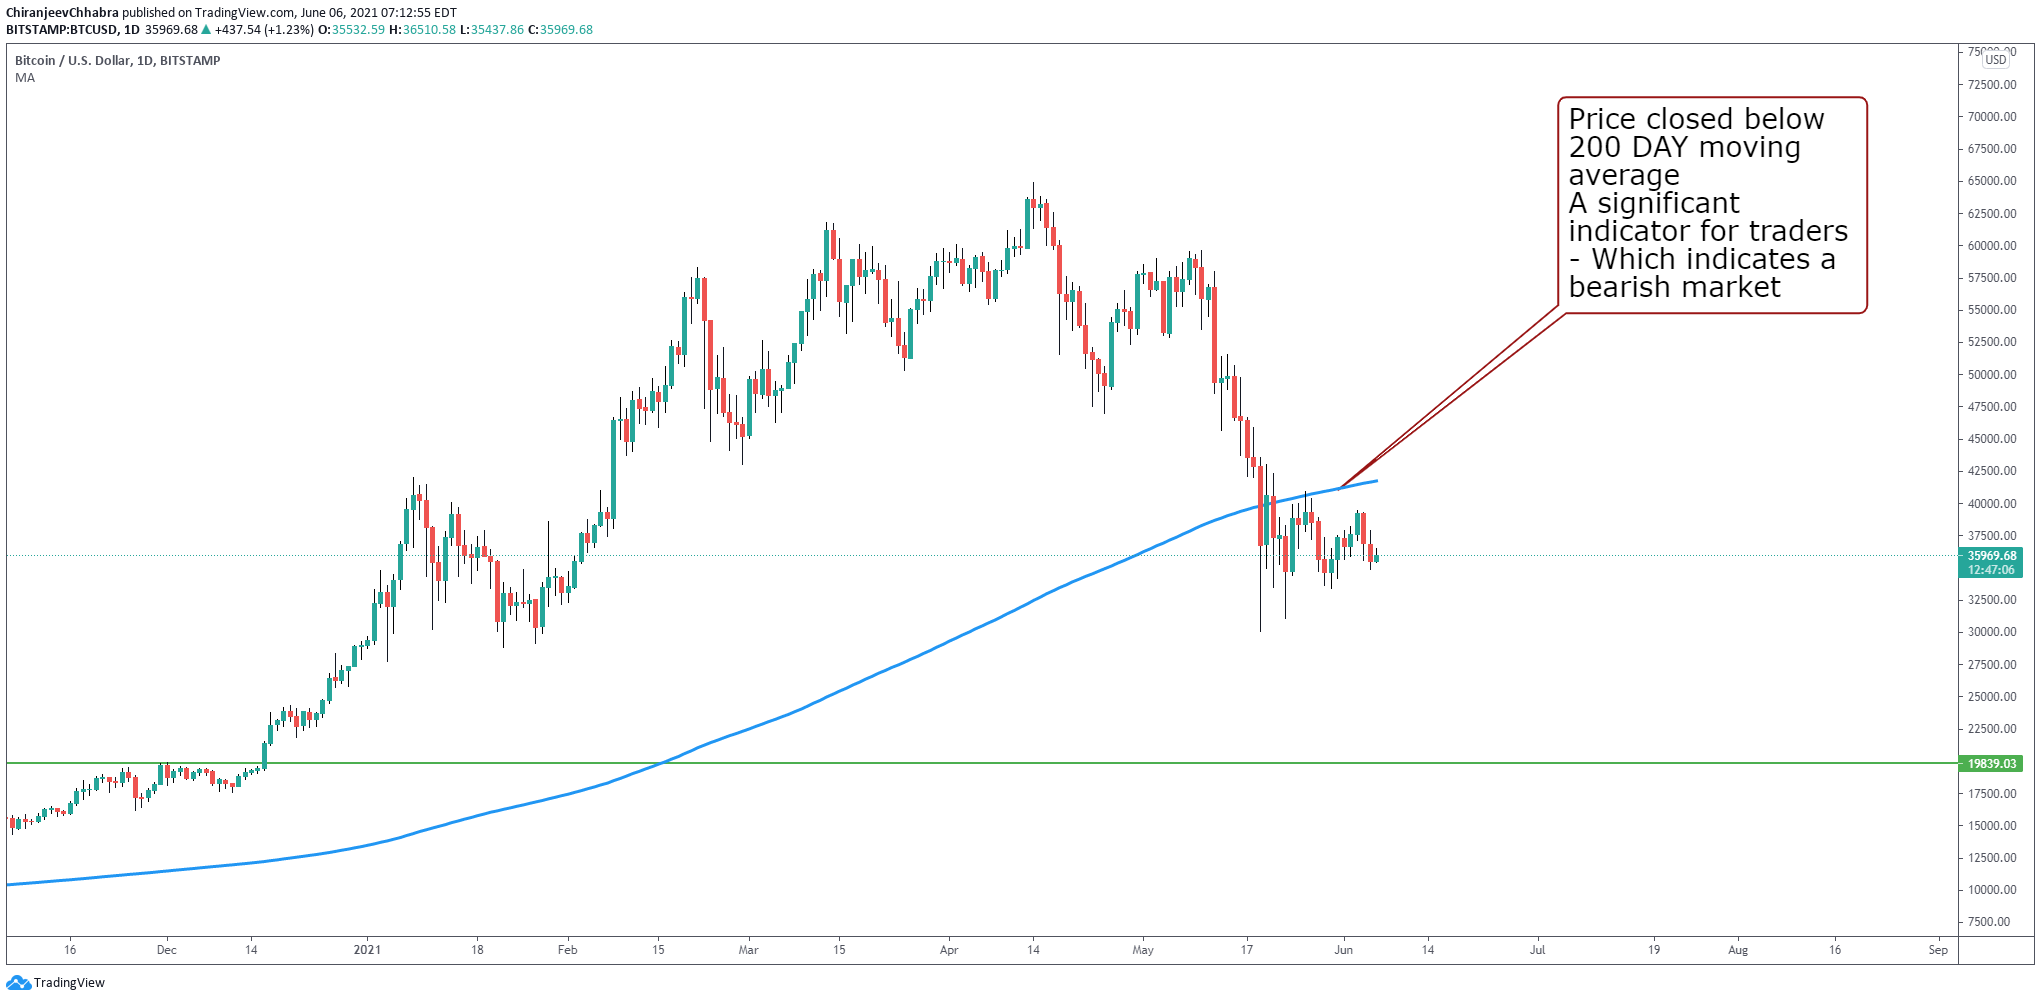
1.Price broke the 200-day moving average ( a technical indicator – indicates bearish price movement )
After breaking the Moving average price stayed below – Which mean the 200-day moving average is now acting as a resistance to the price – which is also a bearish sign for bitcoin
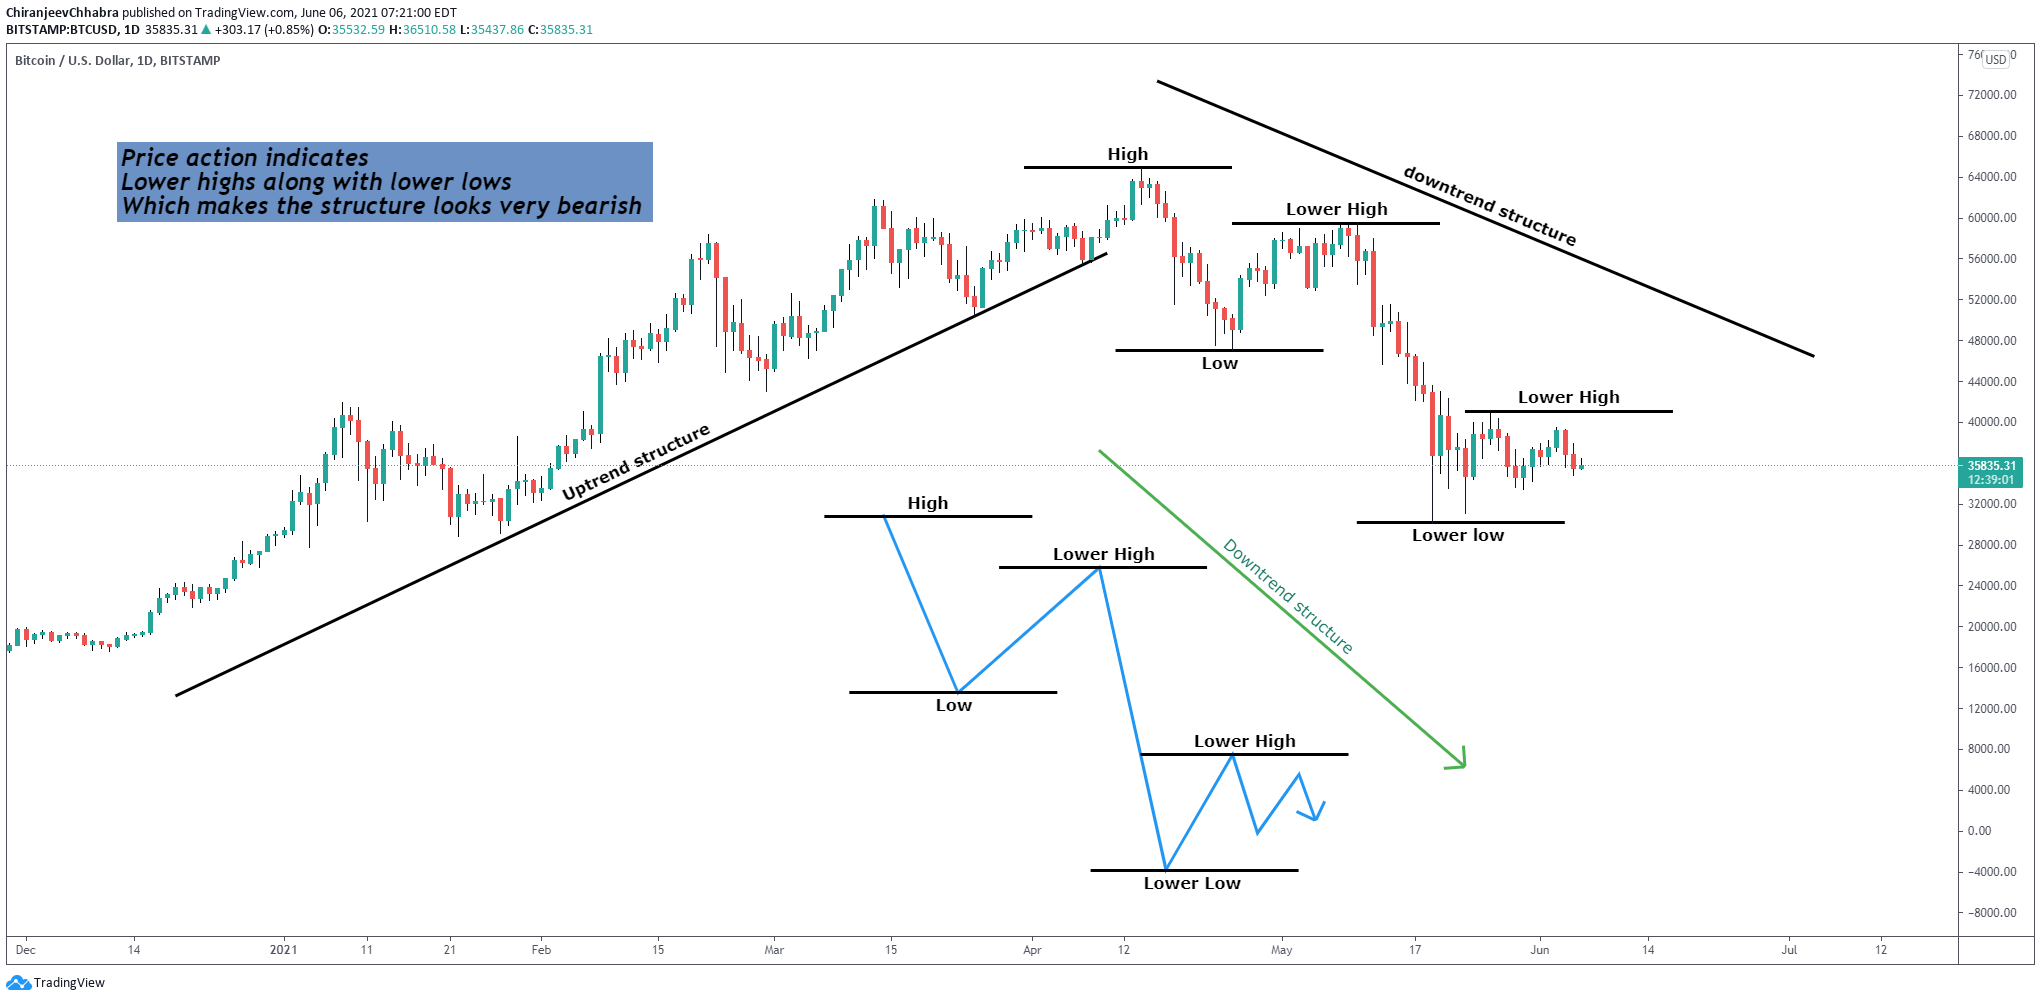
2. Price action is basically a study without any technical indicators, it is a method of understanding price flow by seeing highs and lows
Generally, if the price is having the lower high structure – it is considered as downtrend – people also look for the lower low structure to confirm the strong downtrend
According to the chart below, we are seeing a similar price action where after price breaking the uptrend structure of higher lows it made a lower high structure with a lower low structure and now consolidating in a narrow range – this price action indicates downtrend
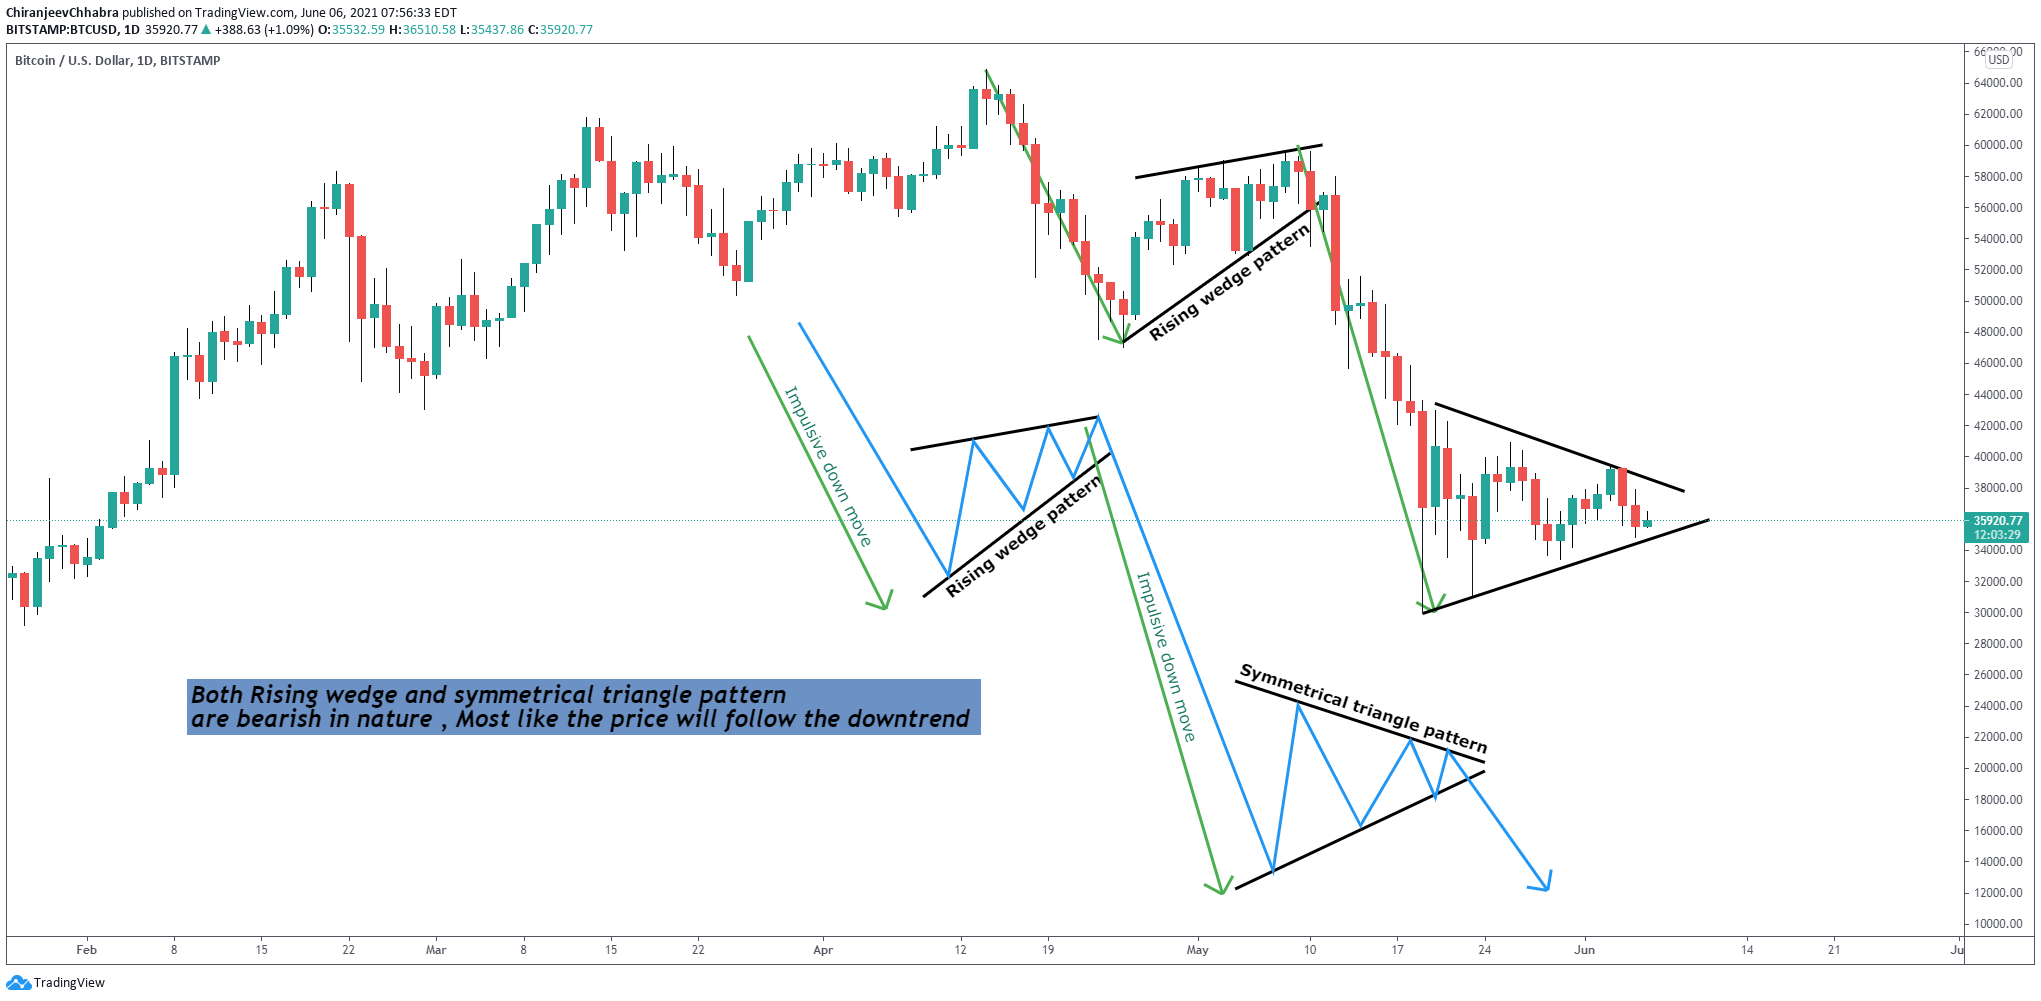
3. Chart patterns are one of the common methods of predicting future price movements there are so many chart patterns the most common ones are wedges and triangle patterns
If you see the chart below we have an impulsive down move after that we were expecting a correction – The correction came in the form of a rising wedge and then price printed another Impulsive wave
After the second impulsive wave we were expecting another correction and this time it was in the form of a symmetrical triangle – which also considered as a trend following pattern – that means the recent trend might continue and we might see another impulsive move