As price is not trending higher more and more people are talking about correction or drop.
Let’s clear some air and see if we have any technical edge at the moment
- As we see price is still respecting 20 Day moving average on a daily which is a key indicator for traders to predict the future price movements
- Price is under the bullish channel this is also favoring buyers at the moment
- Daily candles at the end of the channel are not strong – but this should not be the reason to take a short position at least for now

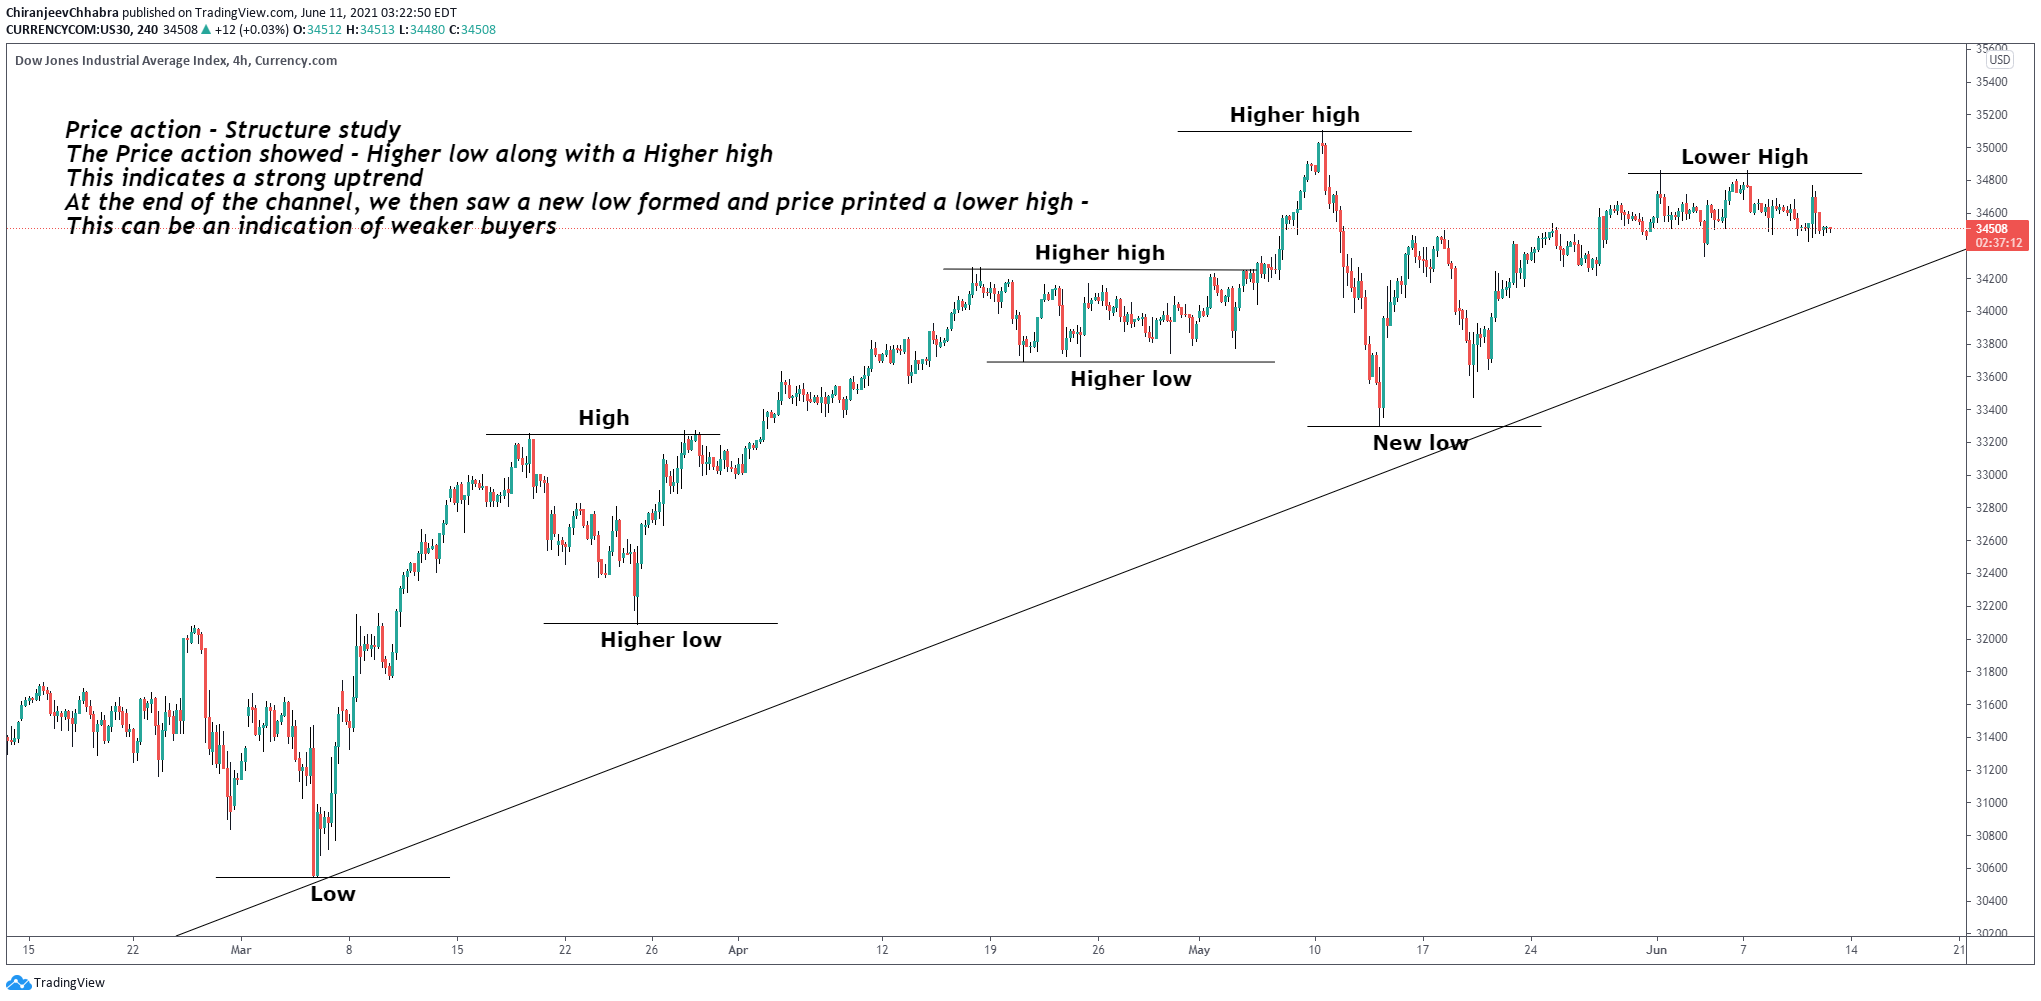
Let’s dig deep and move to a smaller time frame (4Hr) to find out clearer price action
- 4Hr chart below indicated an uptrend initially
- However, we see structure weakness by a new low and lower high – This shows buyers are losing strength
Trade opportunities – Long
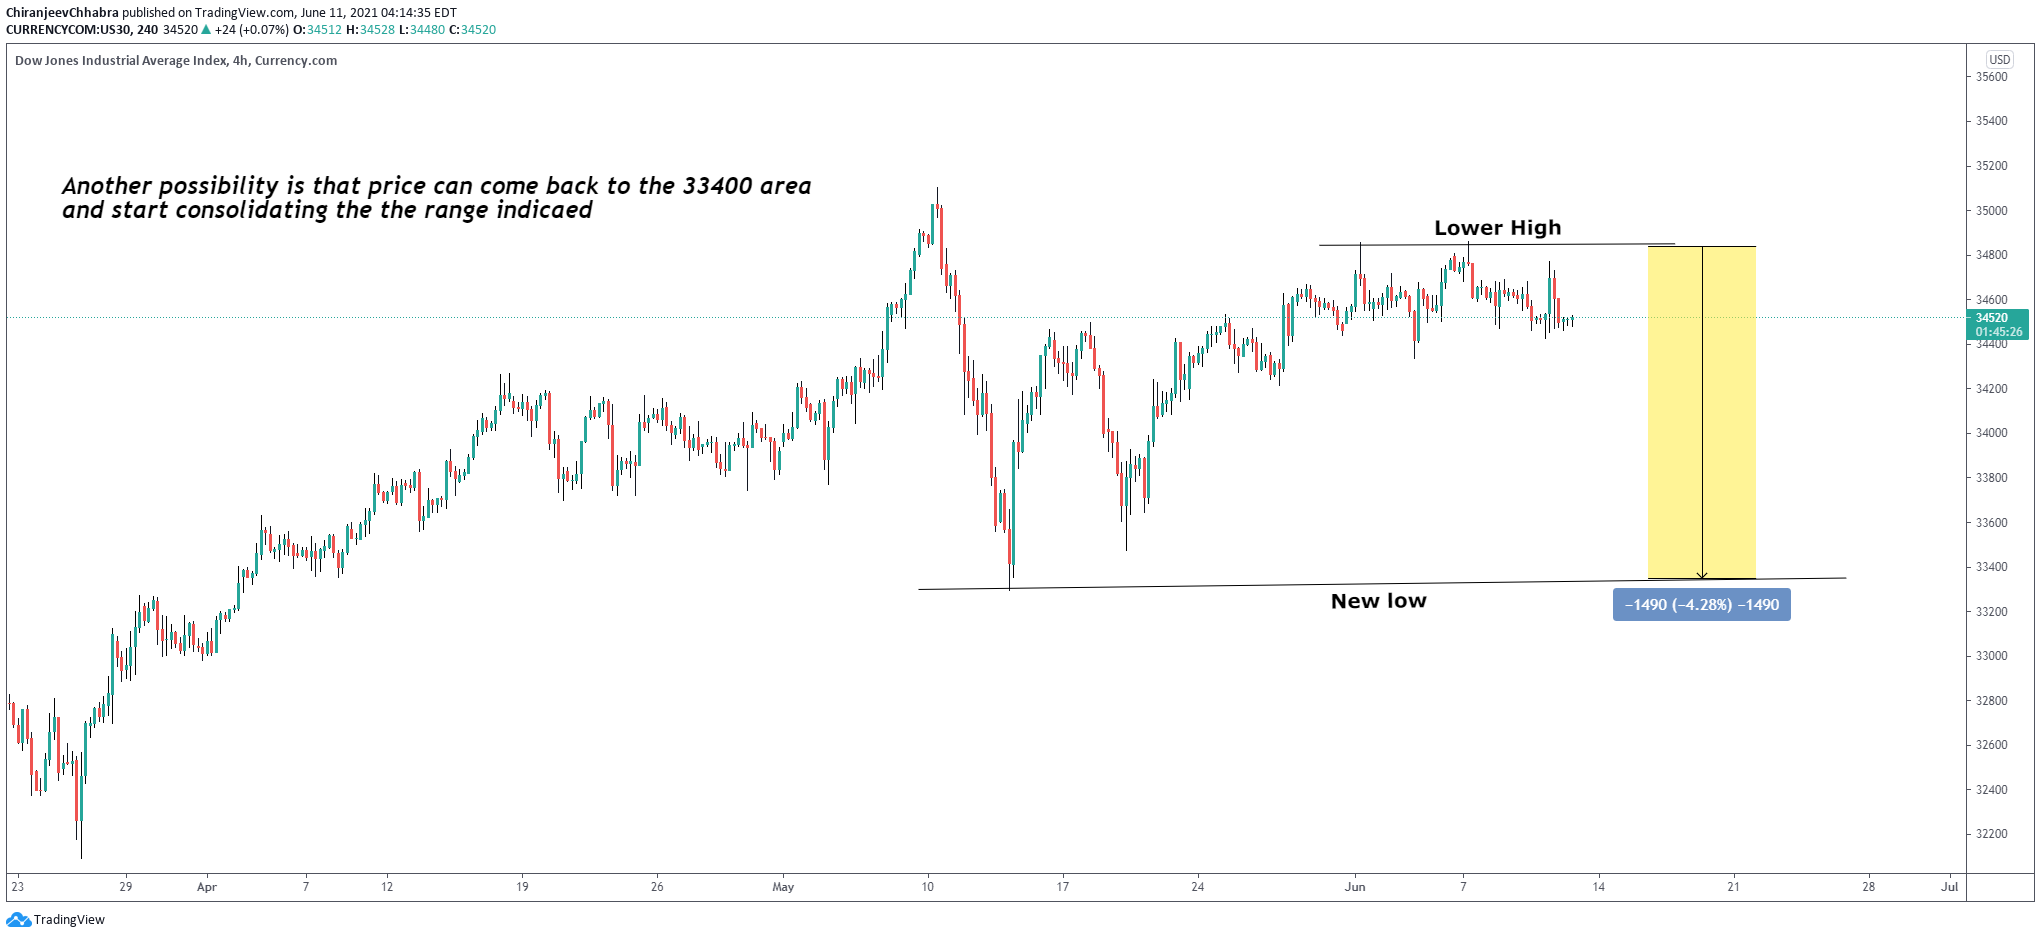
There can be multiple long opportunities two are indicated below on the chart

Another possibility where I won’t be taking any trades when the market starts to consolidate