A plain chart of Bitcoin – hr time frame looks like this
Now see the below 3 charts which will tell you different ways of analyzing trends and changes in trend
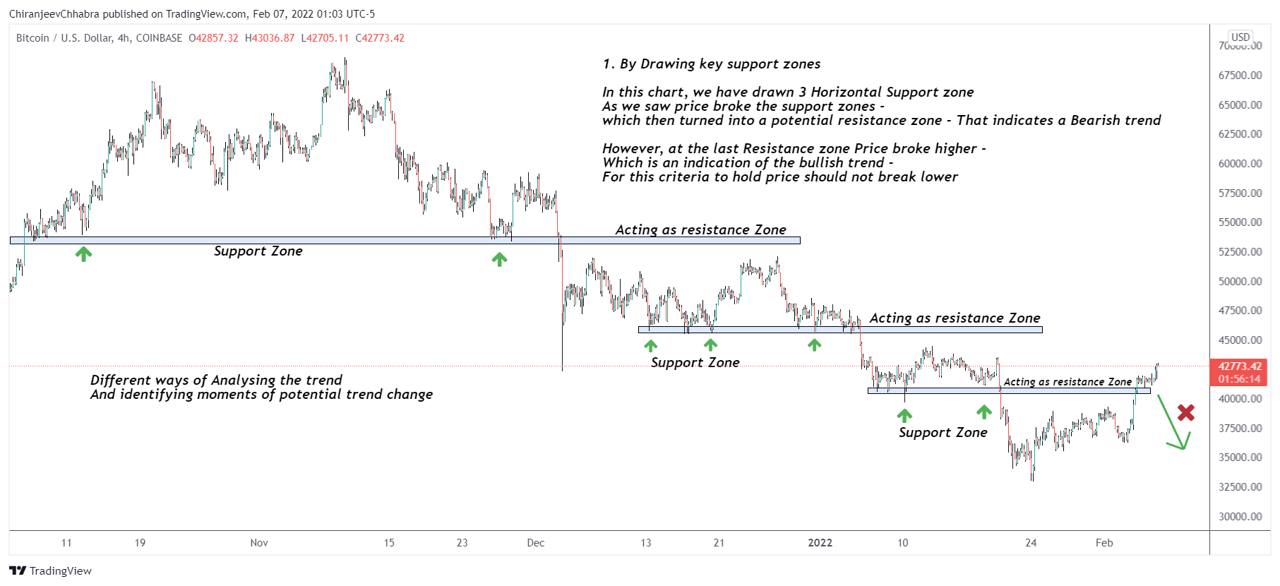
- Drawing Key Support and Resistance zone
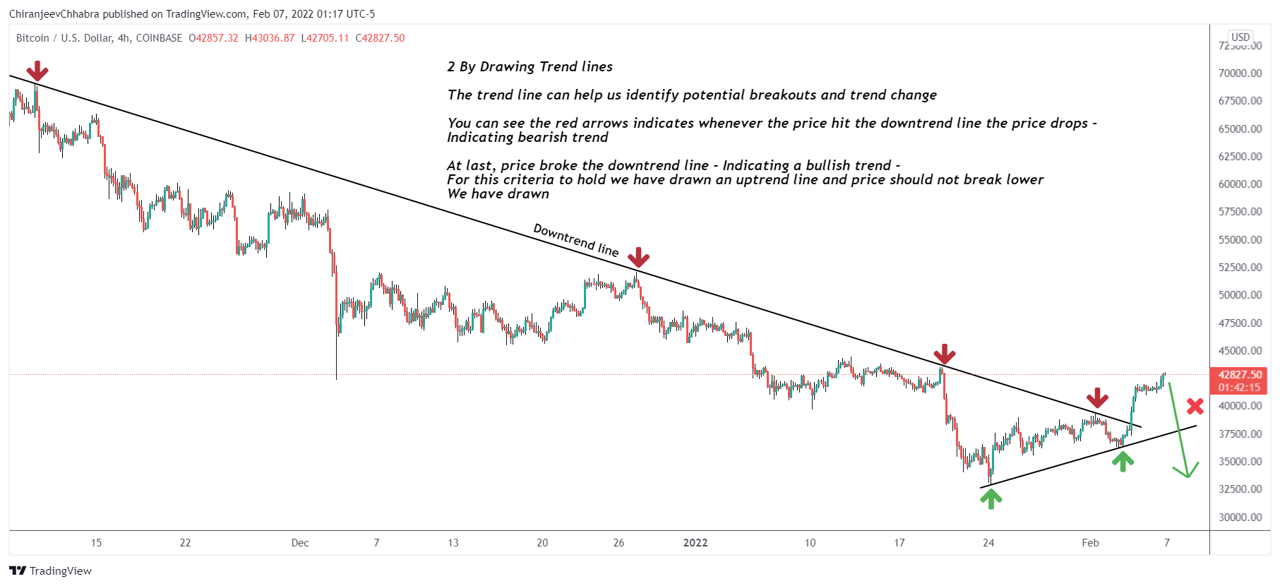
- Drawing Trend lines
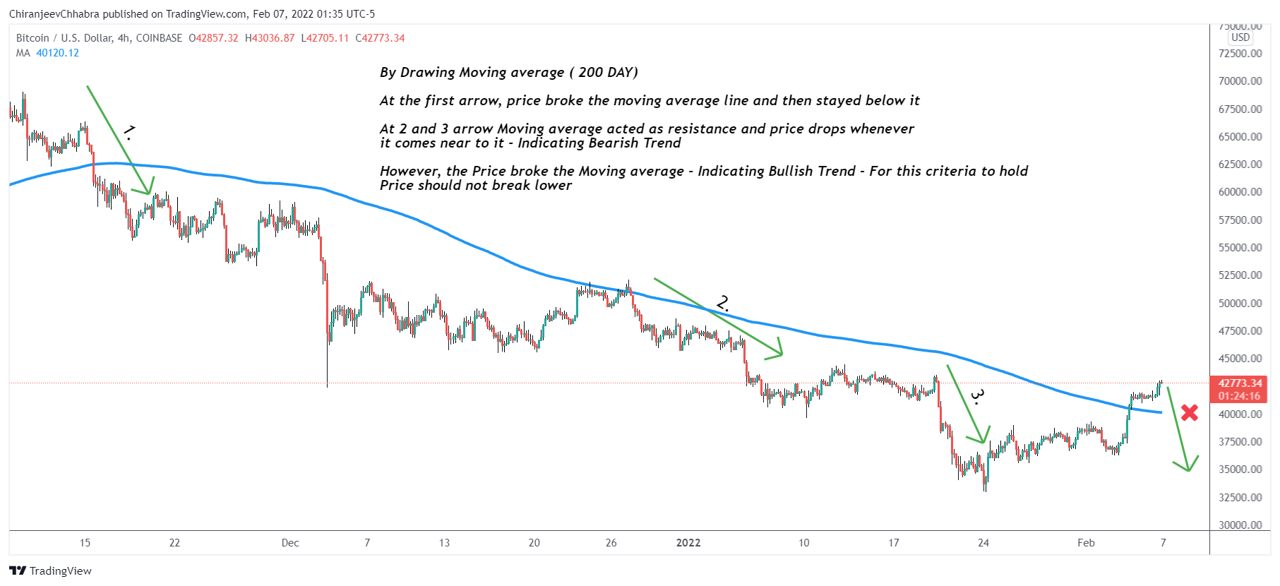
- Drawing Moving Average
By Drawing Key Support and resistance zones
By Drawing Trend lines
By Drawing Moving Average
Register with us and learn how to trade
Open an account and contact us – we offer intensive training programs
Here is the link