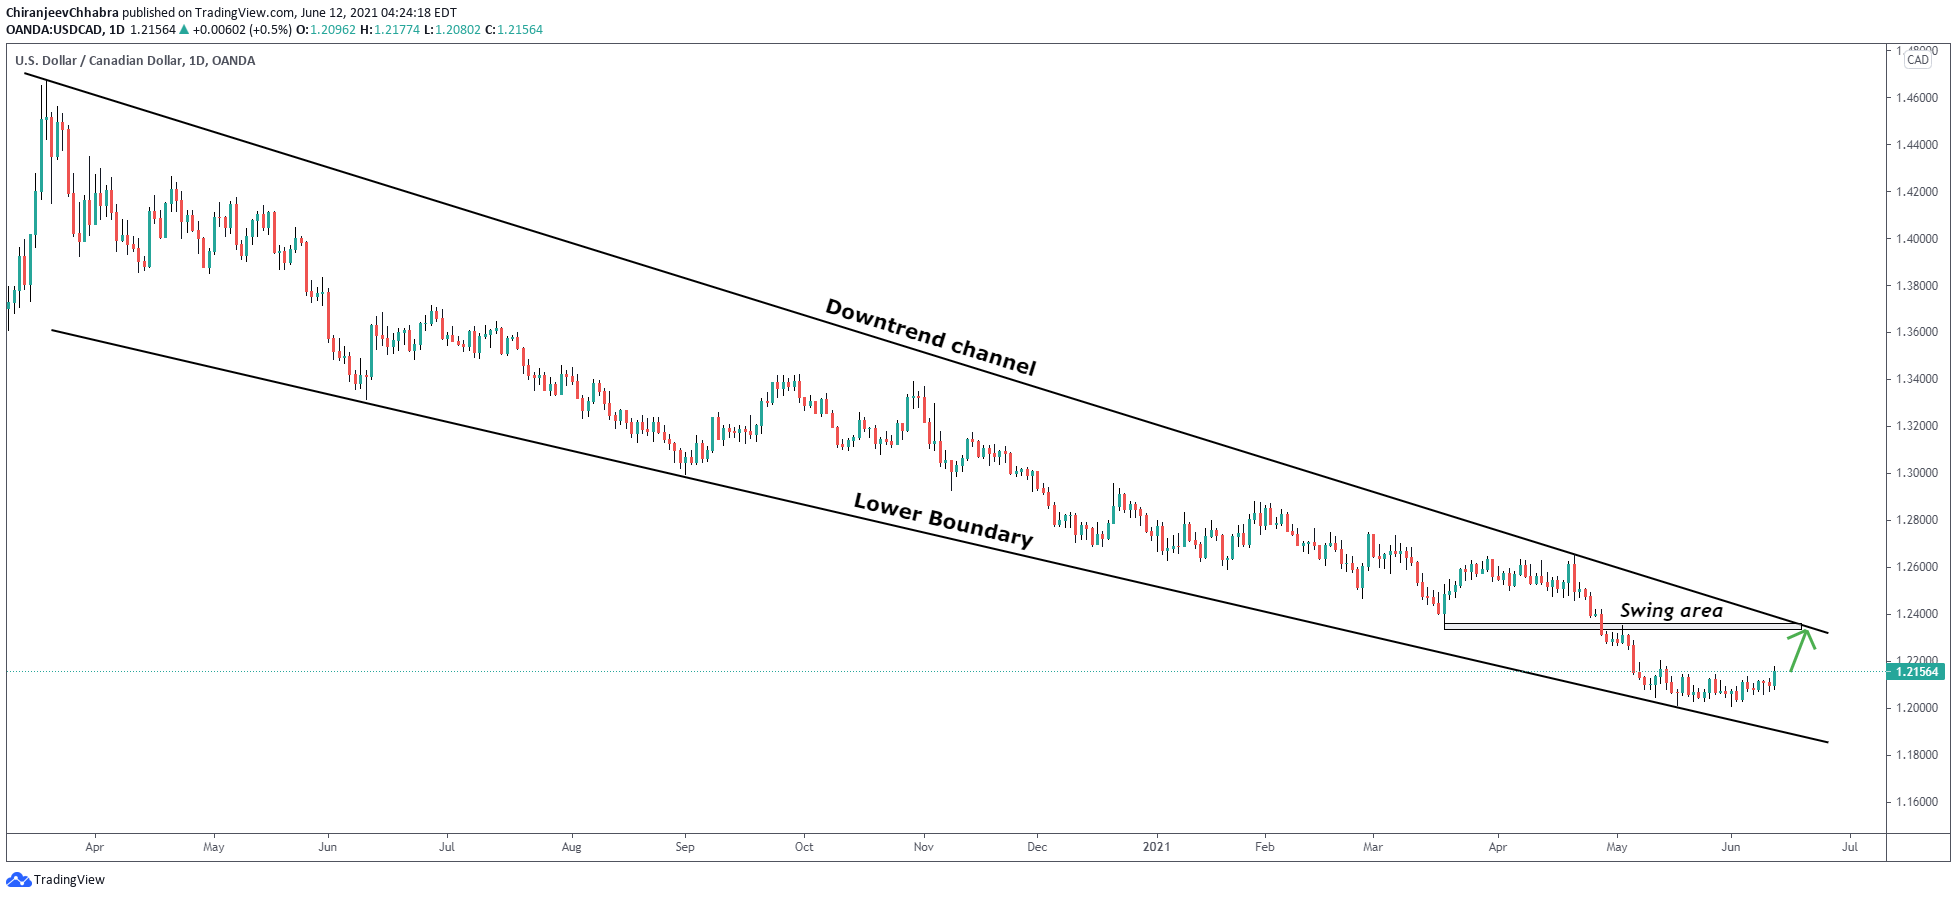
USD touched 5 years low against CAD, which kept us thinking should we look for buying opportunities or selling opportunities
This should not be your sole reason to buy because the price touched 5 years low, But this can be one of the reason and if u combine with other confirmations
In the below daily timeframe chart we see price is right at the bottom of the channel – Possible reversal might happen
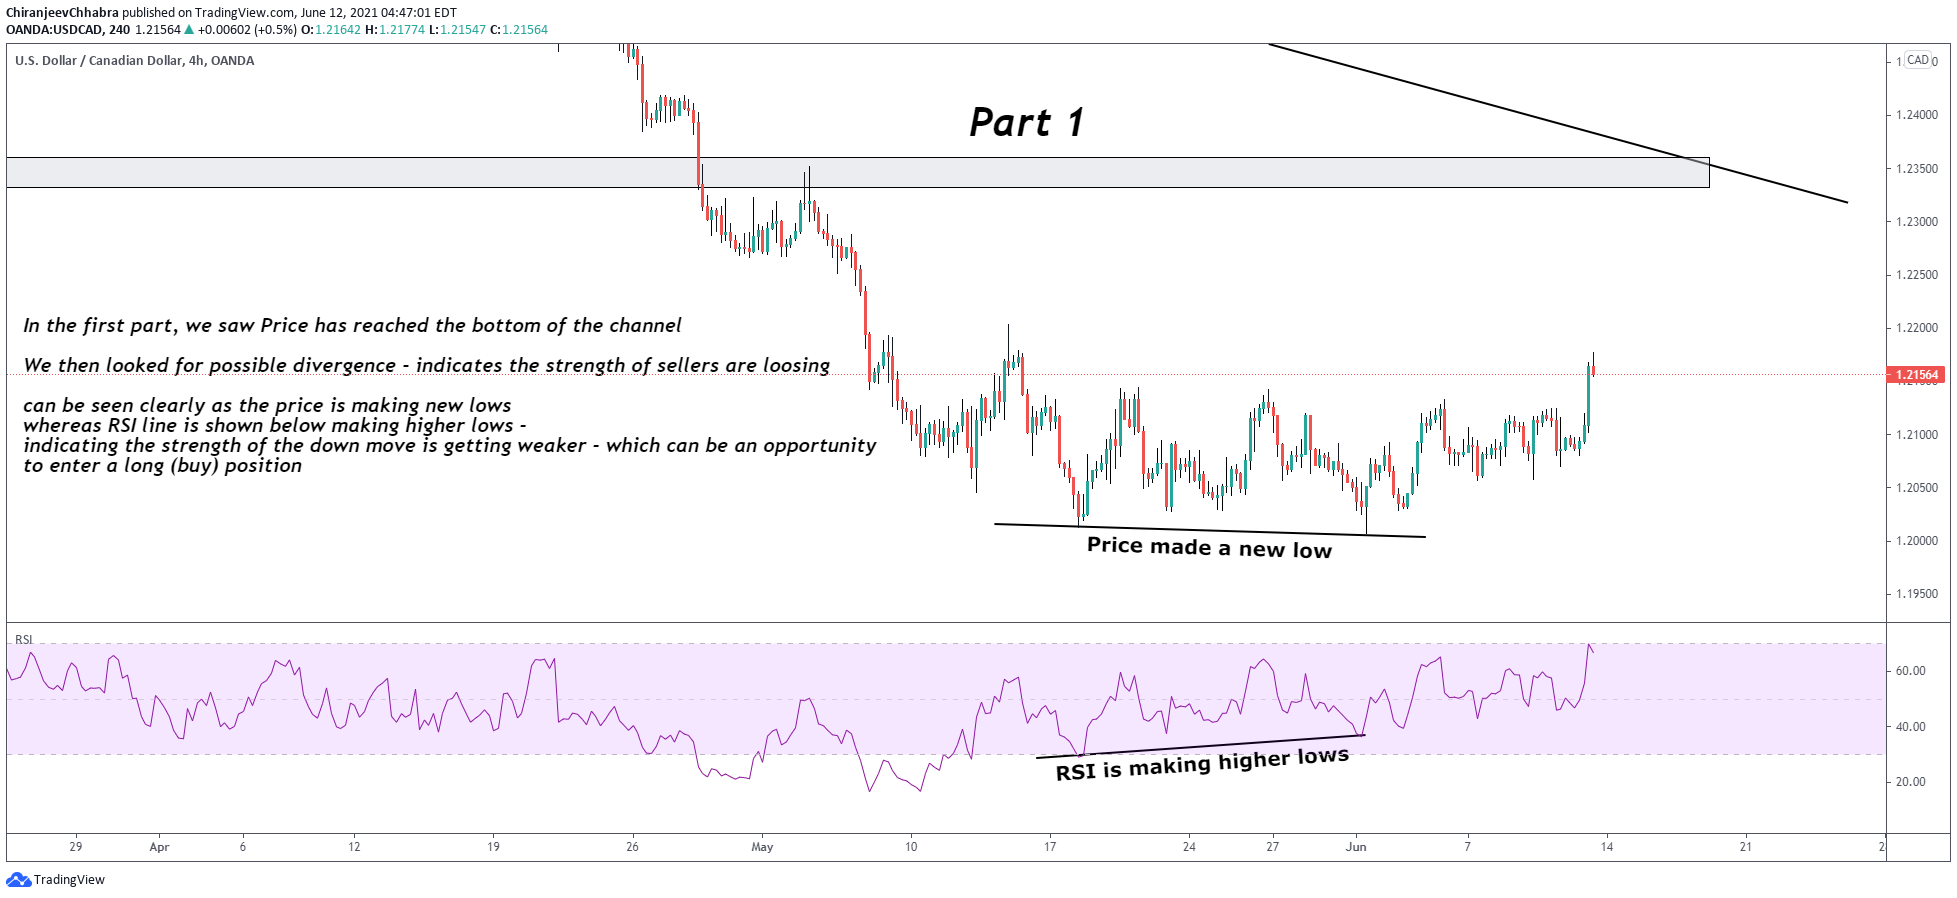
We dropped to a smaller timeframe to understand can we get any structure break towards upside to get confirmation to take a long opportunity
RSI combined with price shower divergence – shown below – another sign of sellers losing strength
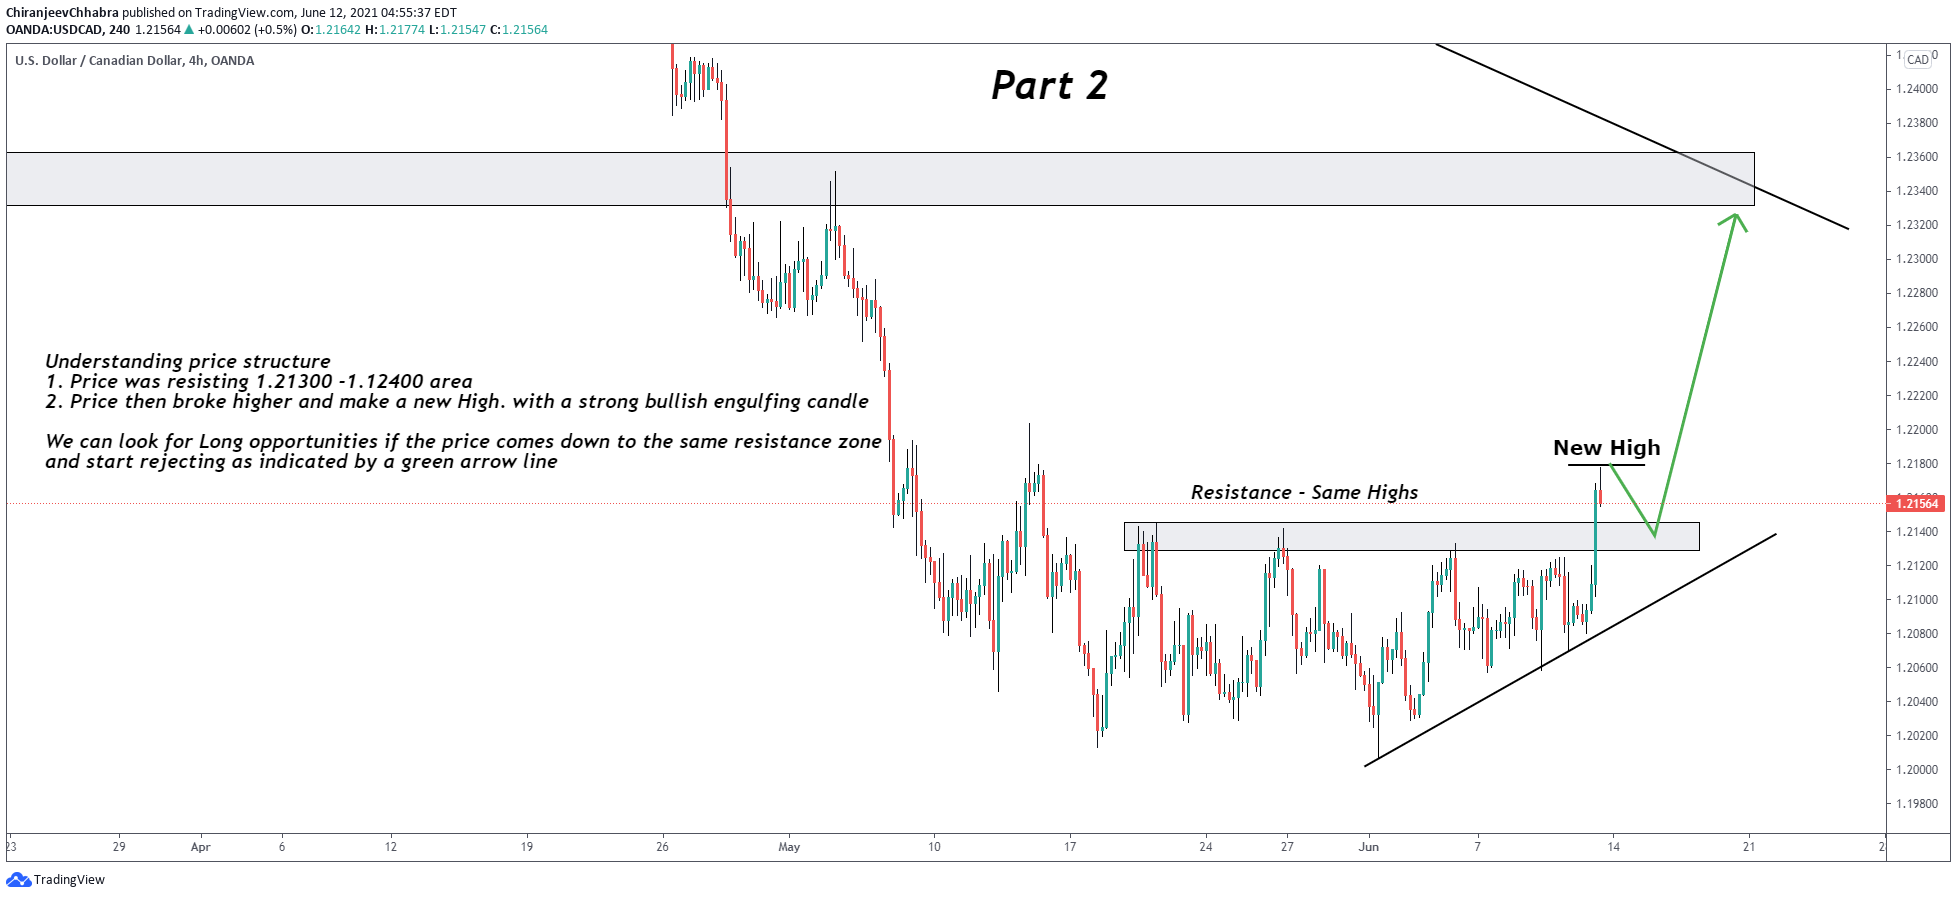
Looking at the price structure we then saw price broke higher clearing the recent resistance
- price broke strongly with bullish engulfing candle – read more about candlestick patterns here
- After the price broke it closed above the resistance zone – which also means buyers were strong kept the price above the zone
- we will wait for the price to retest the zone and create support here as indicated by the green arrow line