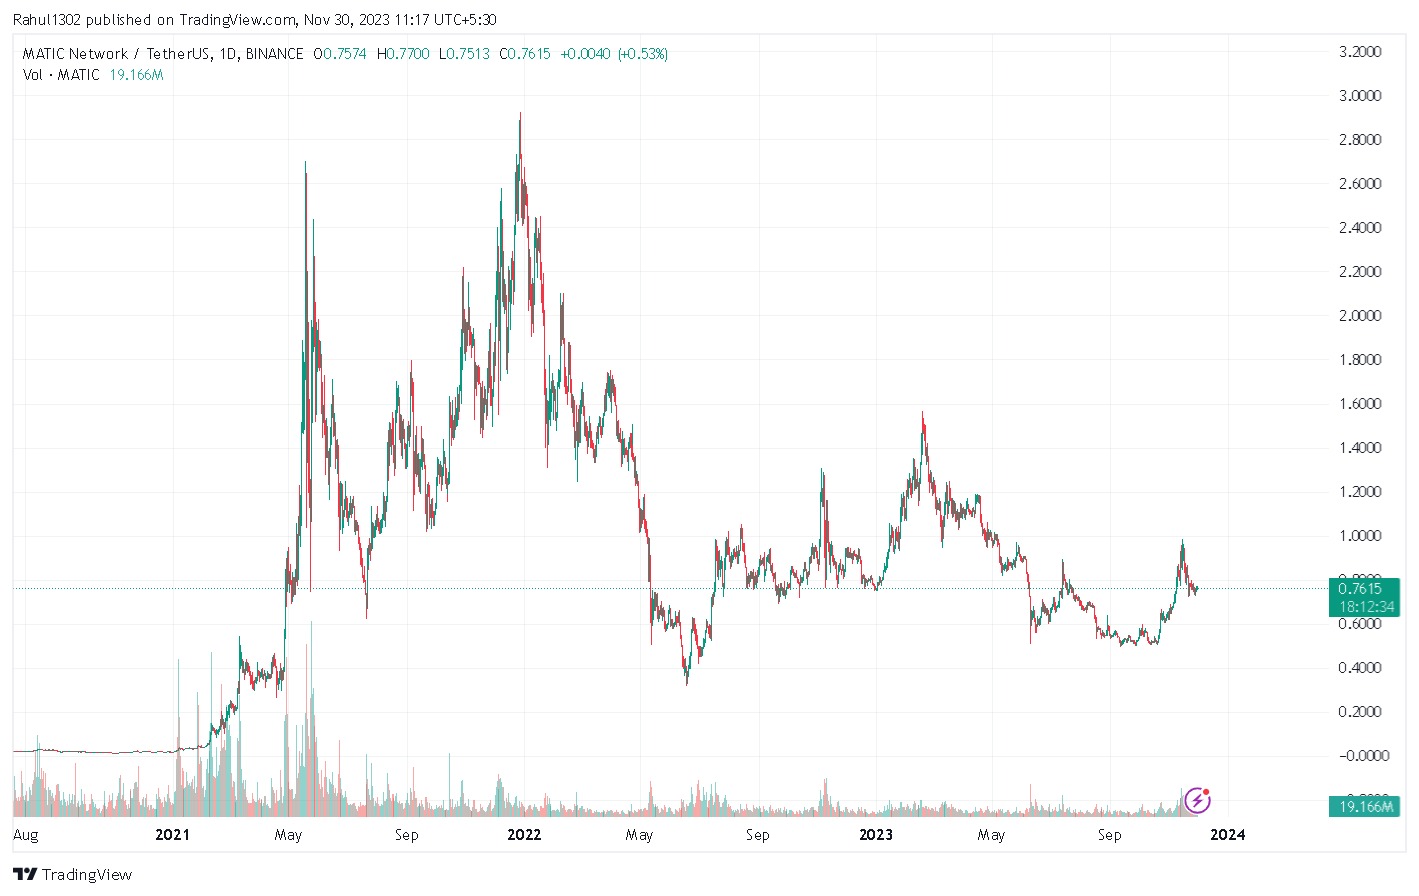
The daily chart of MATIC/USDT shows that the price is currently in a bullish trend. The price has been above the 200-day moving average (MA) since early November, and it is currently trading above a rising support line. The Relative Strength Index (RSI) is also bullish, as it is above 50 and trending upwards. This […]
Explore More