The daily chart of MATIC/USDT shows that the price is currently in a bullish trend. The price has been above the 200-day moving average (MA) since early November, and it is currently trading above a rising support line.
The Relative Strength Index (RSI) is also bullish, as it is above 50 and trending upwards. This suggests that there is more buying pressure than selling pressure in the market.
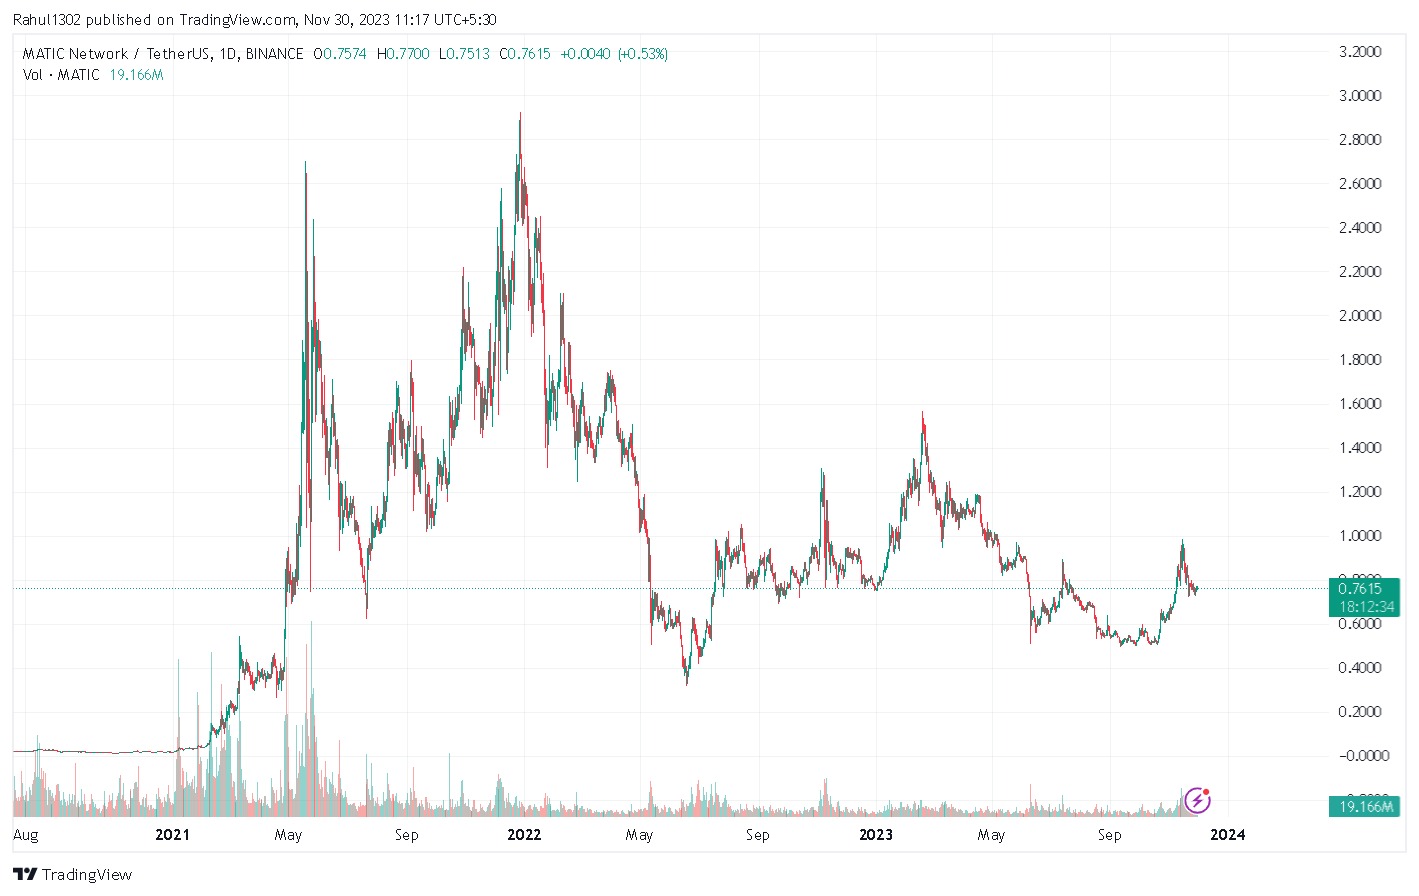
MATIC/USDT daily chart on Trading View
Key technical levels:
Support: $0.7513, $0.7331, $0.7150
Resistance: $0.7700, $0.7822, $0.8000
Trade setup:
Buy entry: $0.7615
Stop loss: $0.7441
Take profit: $0.7822
Risk: 1.1%
Reward: 2.6%
Overall, the technical analysis of MATIC is bullish. The price is above the 200-day MA and a rising support line, and the RSI is above 50 and trending upwards. Traders can look for buy opportunities above $0.7615, with a stop loss below $0.7441 and a take profit at $0.7822.
Please note that this is just a trade idea and not financial advice. Always do your research before making any trading decisions.
If you want to learn more about investing and want to book a free session with us WhatsApp us now.