Trend: Downtrend
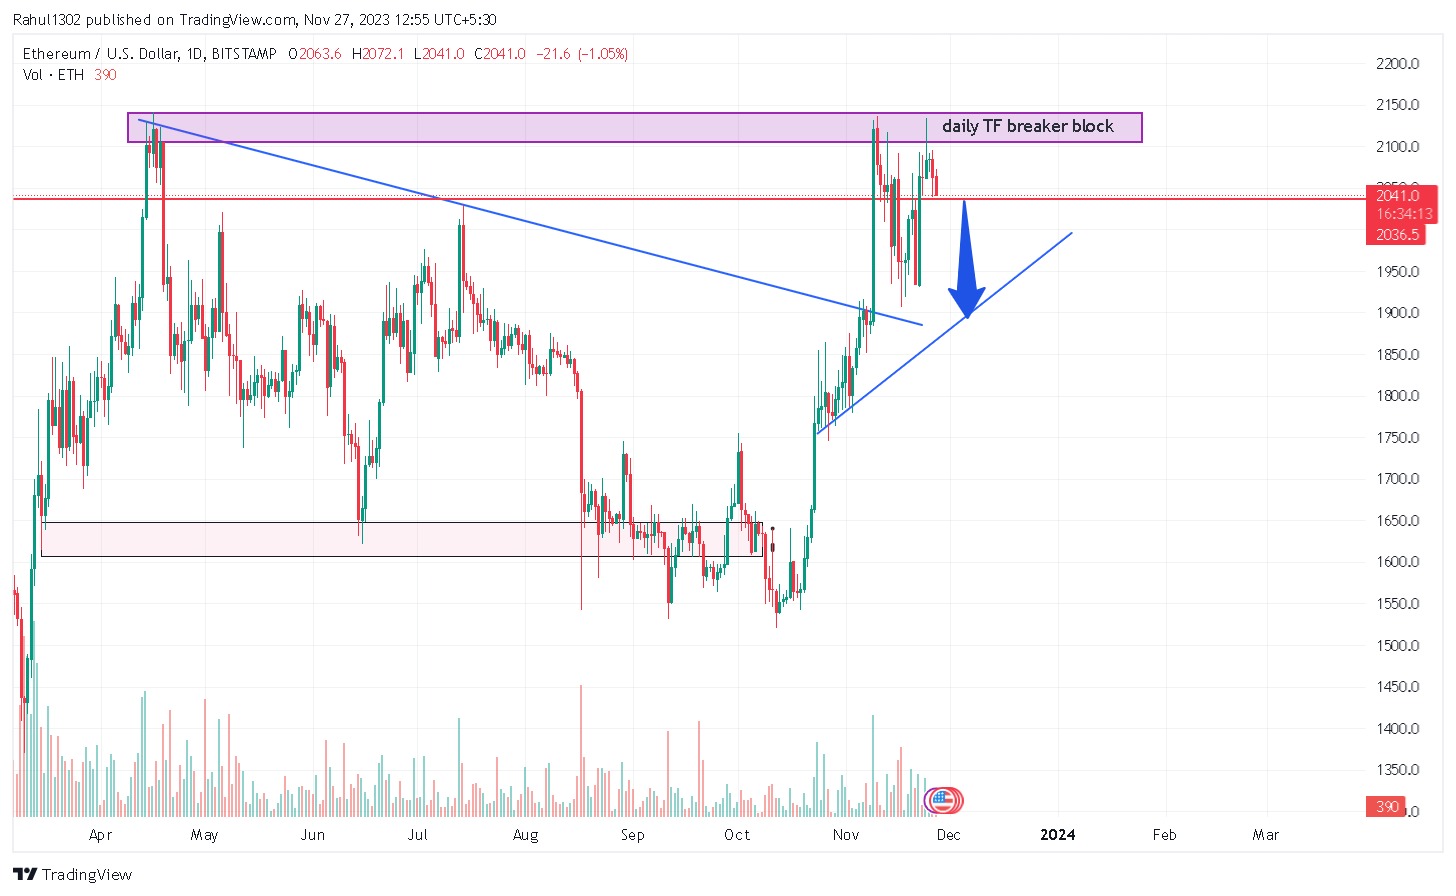
Price: $2,041.00
Technical Indicators:
Daily Timeframe Breaker Block: This is a technical indicator that identifies potential breakout levels. In the provided image, the breaker block is located at $2,150.00.
Moving Averages: The 20-day and 50-day moving averages are both below the current price, which indicates that the price is in a downtrend.
Stochastic Oscillator: The Stochastic Oscillator is a momentum indicator that measures the relationship between the closing price and the price range over a given period of time. In the provided image, the Stochastic Oscillator is oversold, which indicates that the market is oversold and may be due for a rebound.
Overall Analysis:
Based on the technical analysis, the price of Ethereum is in a downtrend. However, the Stochastic Oscillator is oversold, which indicates that the market may be due for a rebound, but I’m still bearish in Ethereum. If the price can break above the breaker block at $2,150.00, it could signal a start of a new uptrend.
Trading Recommendations:
You can go for a short positions now and the targets could be near $1900.
Please note that this is just a technical analysis and is not financial advice. Always do your own research before making any trading decisions.
If you want to learn more about investing and want to book a free session with us WhatsApp us now.