
I was closely looking at bitcoin price movements and i found out that price is moving horizontally from past few days as you can see in the chart above
This rectangle formation can easily tell us entry and exit points and we can make easy money in few days of time
Rectangle is a situation where price moves horizontally and , when u compare the volume u will see high volumes at support levels
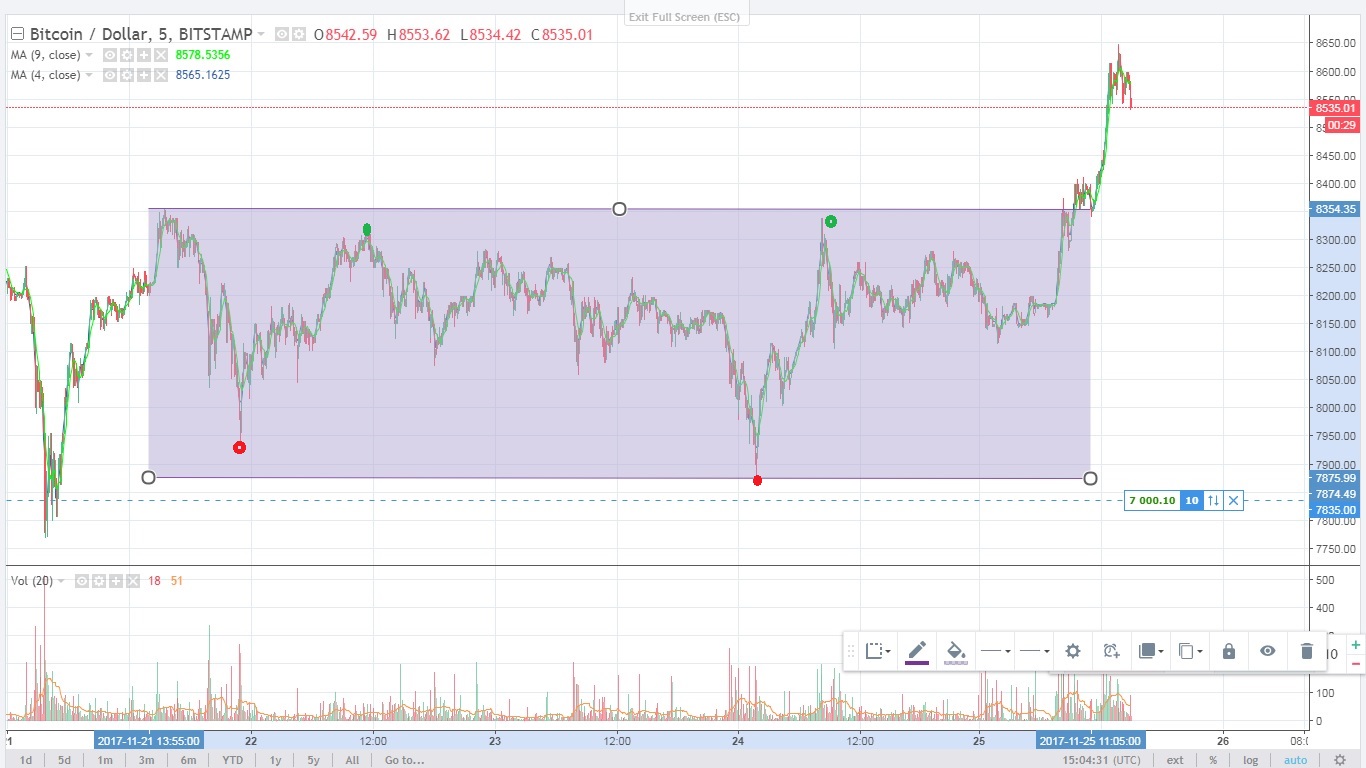
1st trade 22-Nov-2017
we could buy @7933 level at the first RED circle and sell @ 8303 at first GREEN circle
Profit = $ 350
2nd trade 24-Nov-2017
we could buy @7875 level at the second RED circle and sell @ 8337 at second GREEN circle
Profit = $ 462
In a span of 3 days you can end up earning $350 + $462 = $812
Price has then moved to a new level now and trading at upwards of 8500 level
Note : please invest at your own risk
I will be writing more about it shortly
Take care
Stay fit