
More uncertainty in the world will lead the price to go higher. Russian people are facing monetary issues ATM withdrawals are limited The ruble dropped 30% Russians are buying Bitcoin Here is the Bitcoin chart at a daily time frame indicating the downtrend line is broken Now let’s see how bullish scenario looks like Also […]
Explore MoreNew money inflow is coming on a regular basis. Corporate giants are accumulating more and more BTC. There is no exact date but most likely anytime from now till Dec period. When it happens, we will likely cross 10T market cap in this super cycle season We are noticing huge outflow of BTC from exchanges […]
Explore More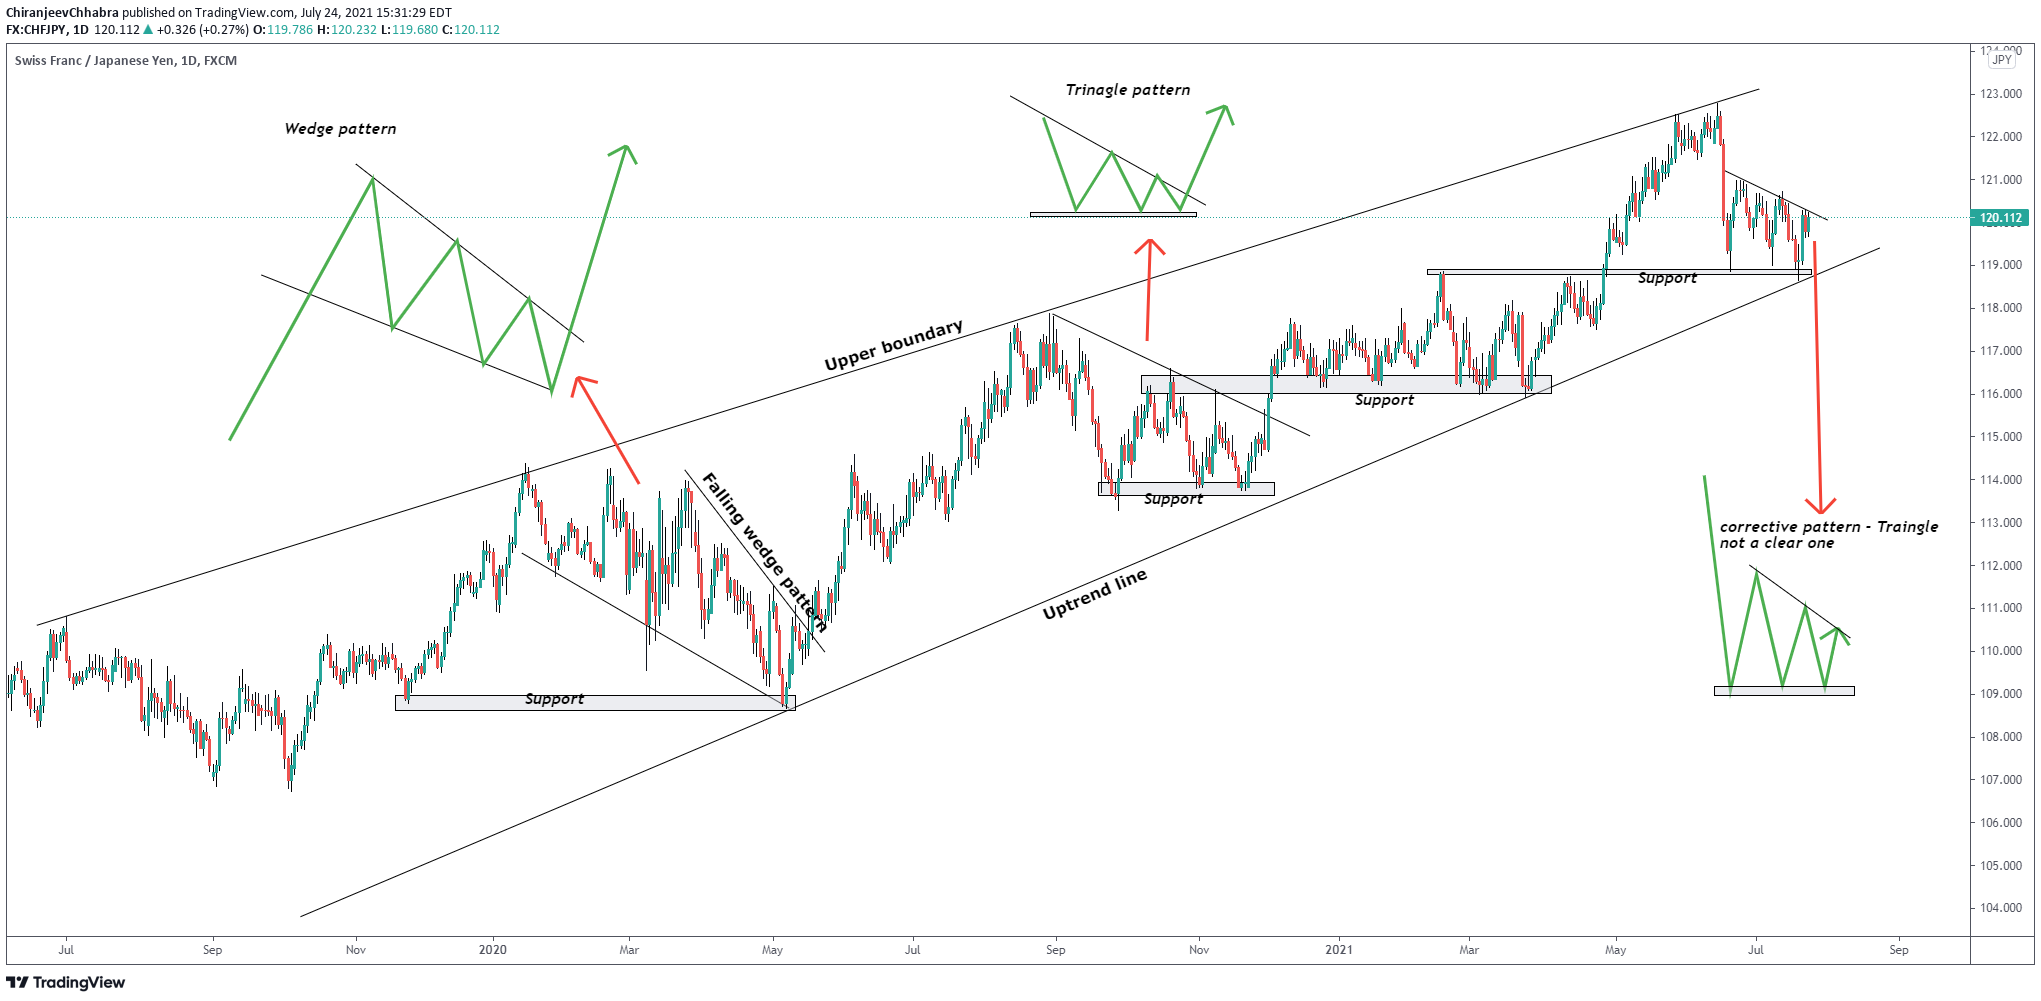
We always focus on impulse and correction and pattern identification Have a look at the chart above which is combined with multiple chart analysis Support Chart patterns Trendline confluences
Explore More
Check out the latest price chart of the top cryptos Click on the link below to download CRYPTO UPDATE
Explore More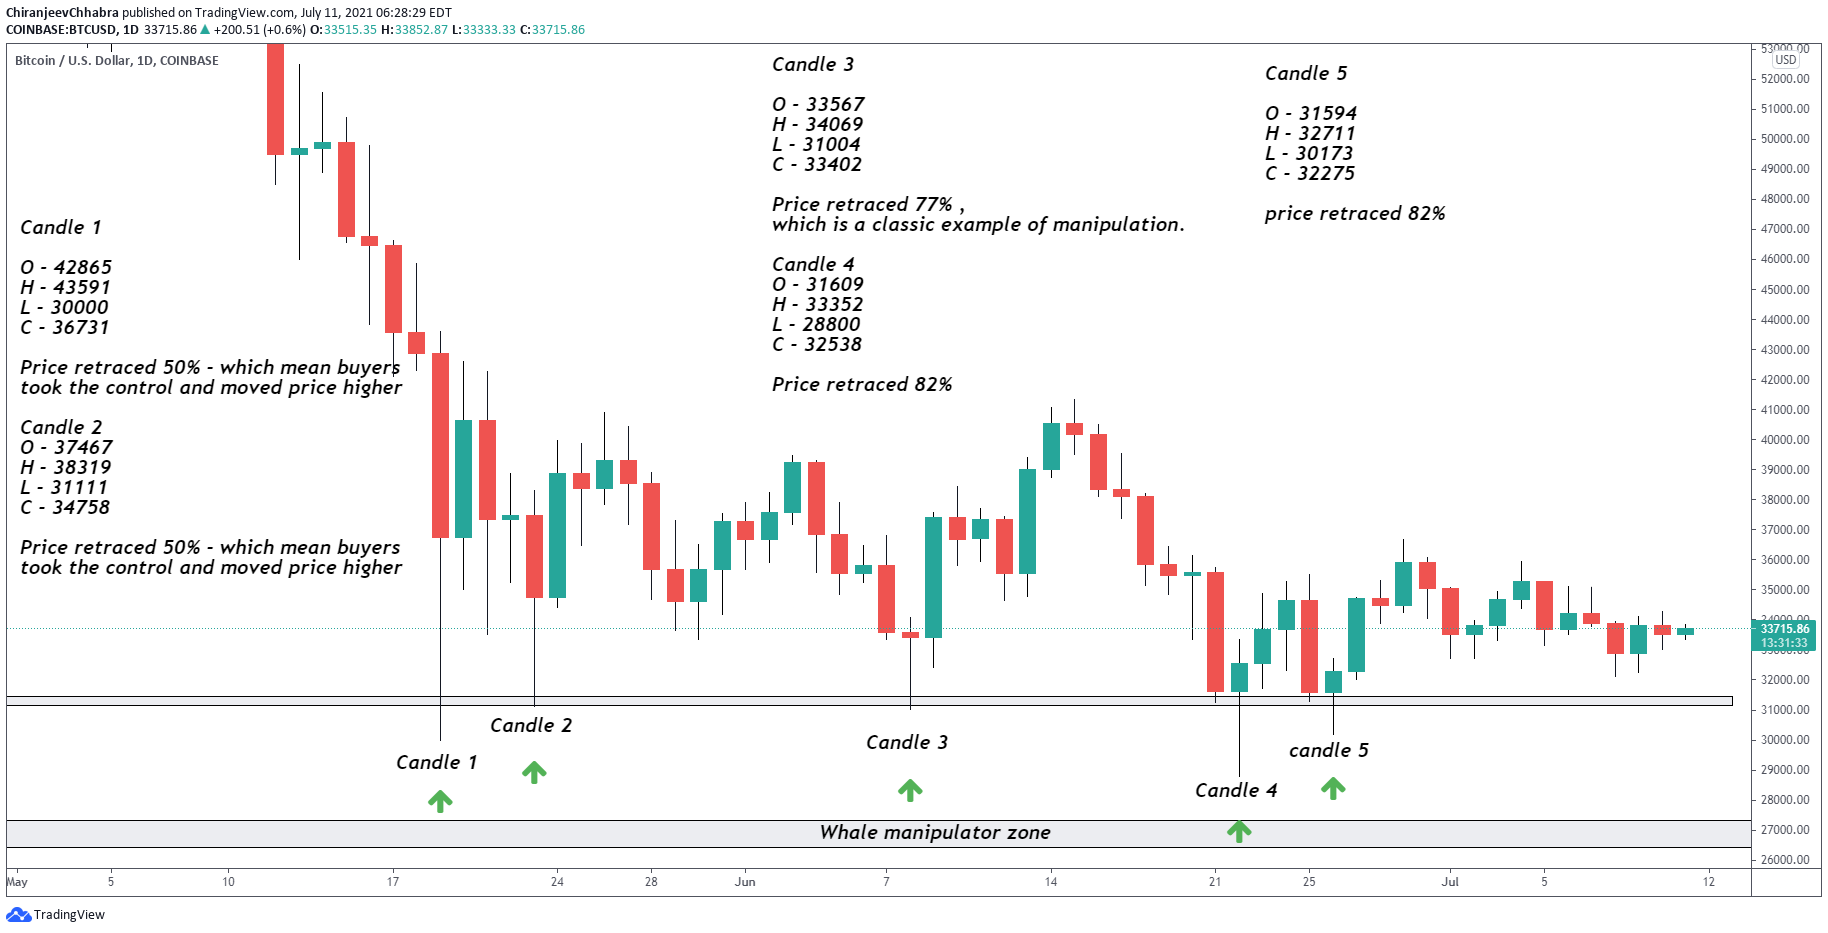
In the last 2 months, we saw price getting heavily manipulated by the whales, in my last blog here, I have mentioned BTC won’t drop below 30K level and even if it does it will not stay there for long Let’s look at those 5 days where price dipped below or near 30K area and […]
Explore More
New BTC are given to Bitcoin miners as their Bitcoin block reward when they verify blocks of transactions. To begin with, the reward stood at 50 BTC per block. This would have been worth under a dollar back in 2009 — but at today’s rates (April 28), the price of Bitcoin would’ve gotten you a […]
Explore More