Essential candlestick patterns
Most of the time we try to find chart patterns like triangle formation for trend continuation, Head and shoulders for potential reversal and many others. However we should also concentrate on price movements and how buyers and sellers are reacting , Most of this information can be extracted by studying candlestick patterns . It also gives an idea about the mentality and psychology of the traders
Before we study different candlestick patterns lets get our basics clear
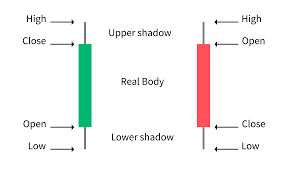
The green candle indicates that the price has gone up from its opening price , hence we see open is below to the close price . The green area is know as the real body , Then we see two tails/Wicks/Shadows , the lower shadow tells us what is the lowest price and upper shadow tells us what is the highest price . Now if the candle is red you can easily make out that the open price is higher than the closing price and prices has gone down
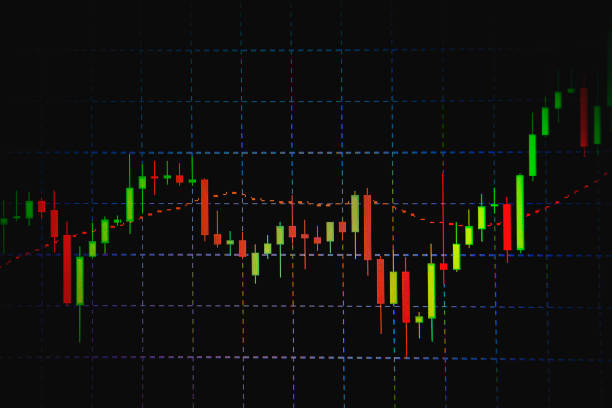
Candle represents price movements in different time frames , you can see candles from 1 Min time frame to 1 week time frame or even higher
Single Candlestick Patters
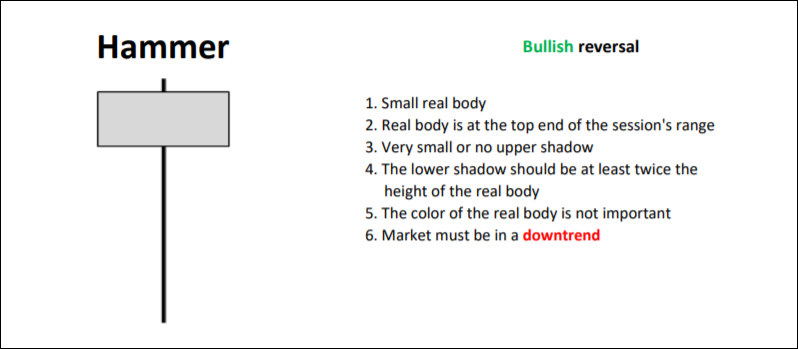
1.Hammer
It shows that sellers are loosing control of the market and its time the when buyers show their strength , if it appears on the support zone at the bottom of the trend it can be a good buy signal , Please note the below points
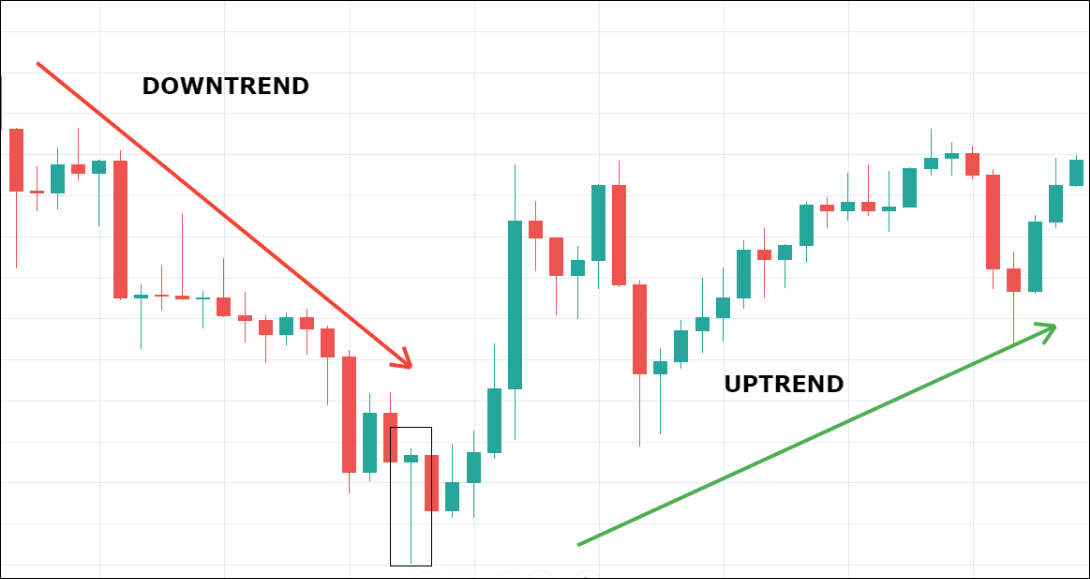
Lets take an example of CADJPY 4 hour chart , you see a candle in the rectangle box , The market was on a downtrend and the Hammer appears right at the bottom of the chart , which showed that sellers are unable to push the price downwards and buyers came into the picture and pulled the price up , which also shows buyers strength in the market . This gives us some insight on potential price reversal
Key points to note when you are trading hammer
- It gives a strong indication if the hammer appears on the support zone
- Buy trade should be placed few pips above the highest price of the hammer
- Stop loss should be places few pips lower to the lower shadow of the hammer
- Market should be on a downtrend
2.Shooting Star
Just an opposite of the hammer
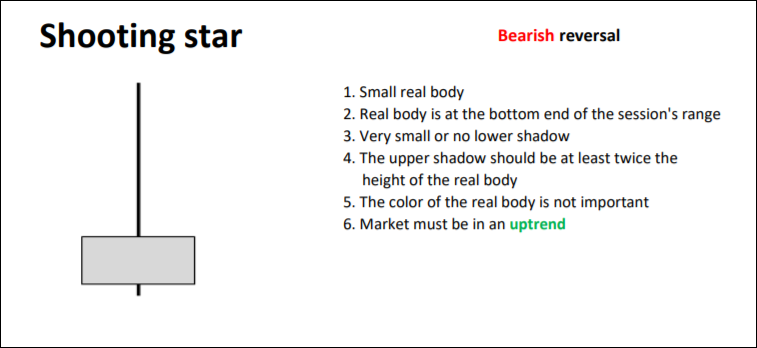
Lets see a real scenario where Shooting star worked well
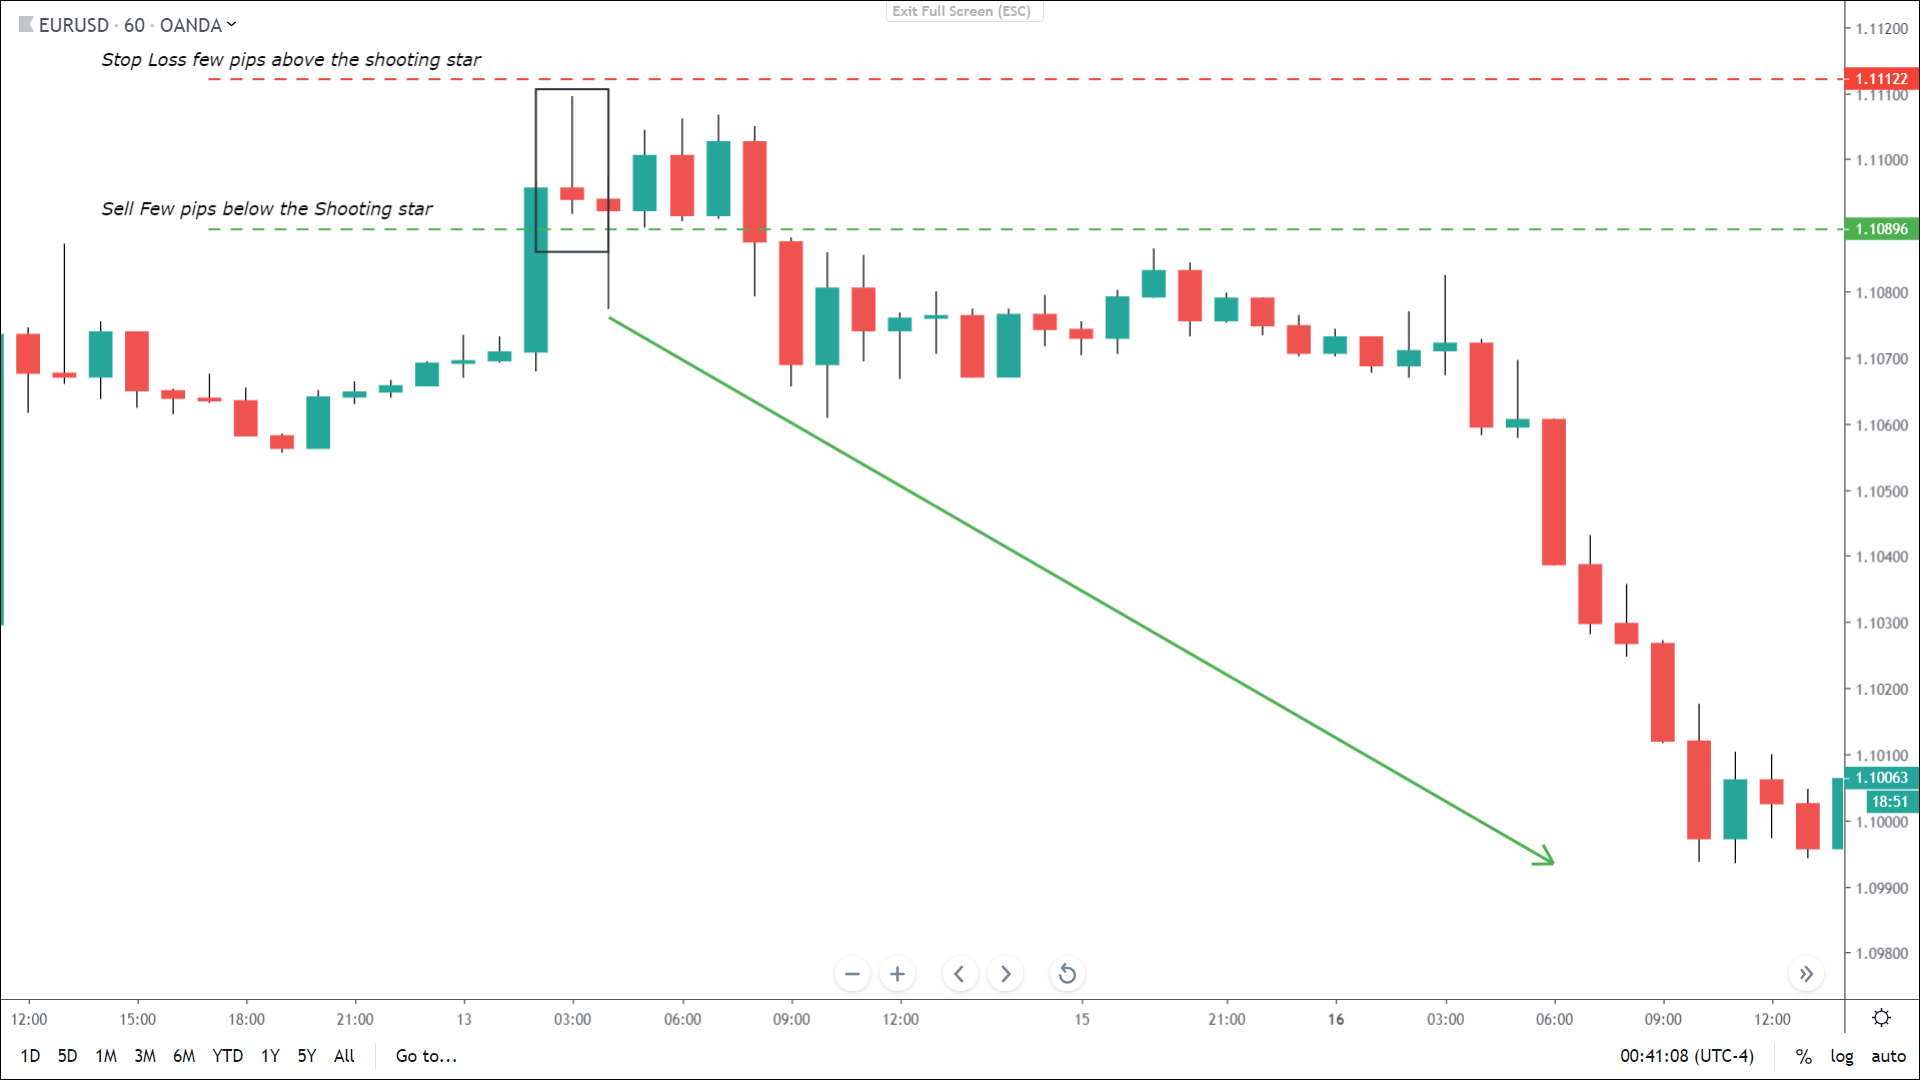
See the rectangle where we have captured a shooting star which adheres to all the important conditions mentioned above
Price starts to go up initially and then went down quickly after couple of 1 Hour sessions
Trade setup
- Your entry should be few pips below the low of the Shooting star which ensures market is continue to fall ( see green dotted line)
- Stop loss should be Few pips higher than the high of the shooting star ( see red dotted line)
- Take profit level can be huge in some these scenarios , However if are unable to find a recent support point , You may pick 1:2 or 1:1.5 risk to reward ration, Or else you first TP should be first Major Support point
Download our Two Candlestick patterns
Take care stay fit
its VERY IMPORTANT and informative blog on candles.
Actually what kind of candles to understand and implement in real time scenario after following a PROCESS..
A. Understand TREND way
B Find for your support and Resistance
C look for proper candle.
Actually each candle is saying something ..
Thanks CJ for your explanations on it.
Gald you liked it Abdul