A chart with no indicators – Clean and naked charts. For most novice traders putting indicators on the chart is the first thing they do secondly they check out oversold and overbought areas on different time zones and third place a trade , end of the story. This technique fails most of the times also if there is any such technique then everyone would be making money which is not the case right !! So lets go back and see how most professional traders trade . Also we will see how to the read price action by just concentrating on the price
- Identifying support and resistance is the first method, we will see how we can use this to find trading opportunities .When u trade naked charts you will always be in a hunt of finding these demand and supply zones mostly in all the time frames
Lets look at a trade setup
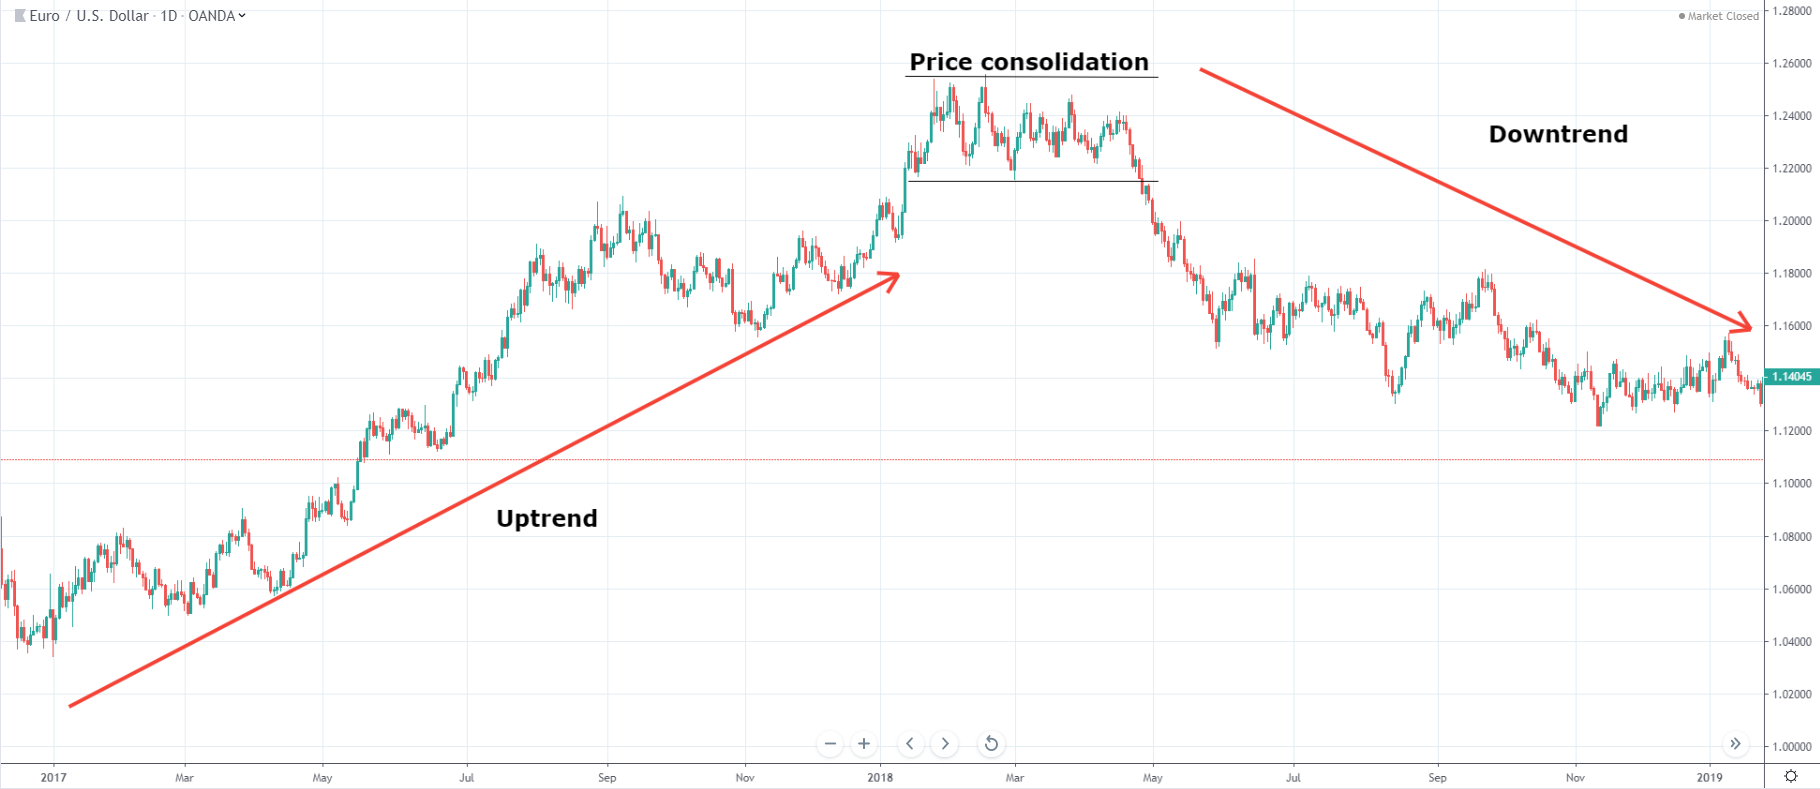 EURUSD pair was in an uptrend from 2017 , in the first quarter of 2018 it started consolidating , then price broke the consolidation range it starts to move downwards, here we will look at the consolidation range and see if we can find any opportunity to trade
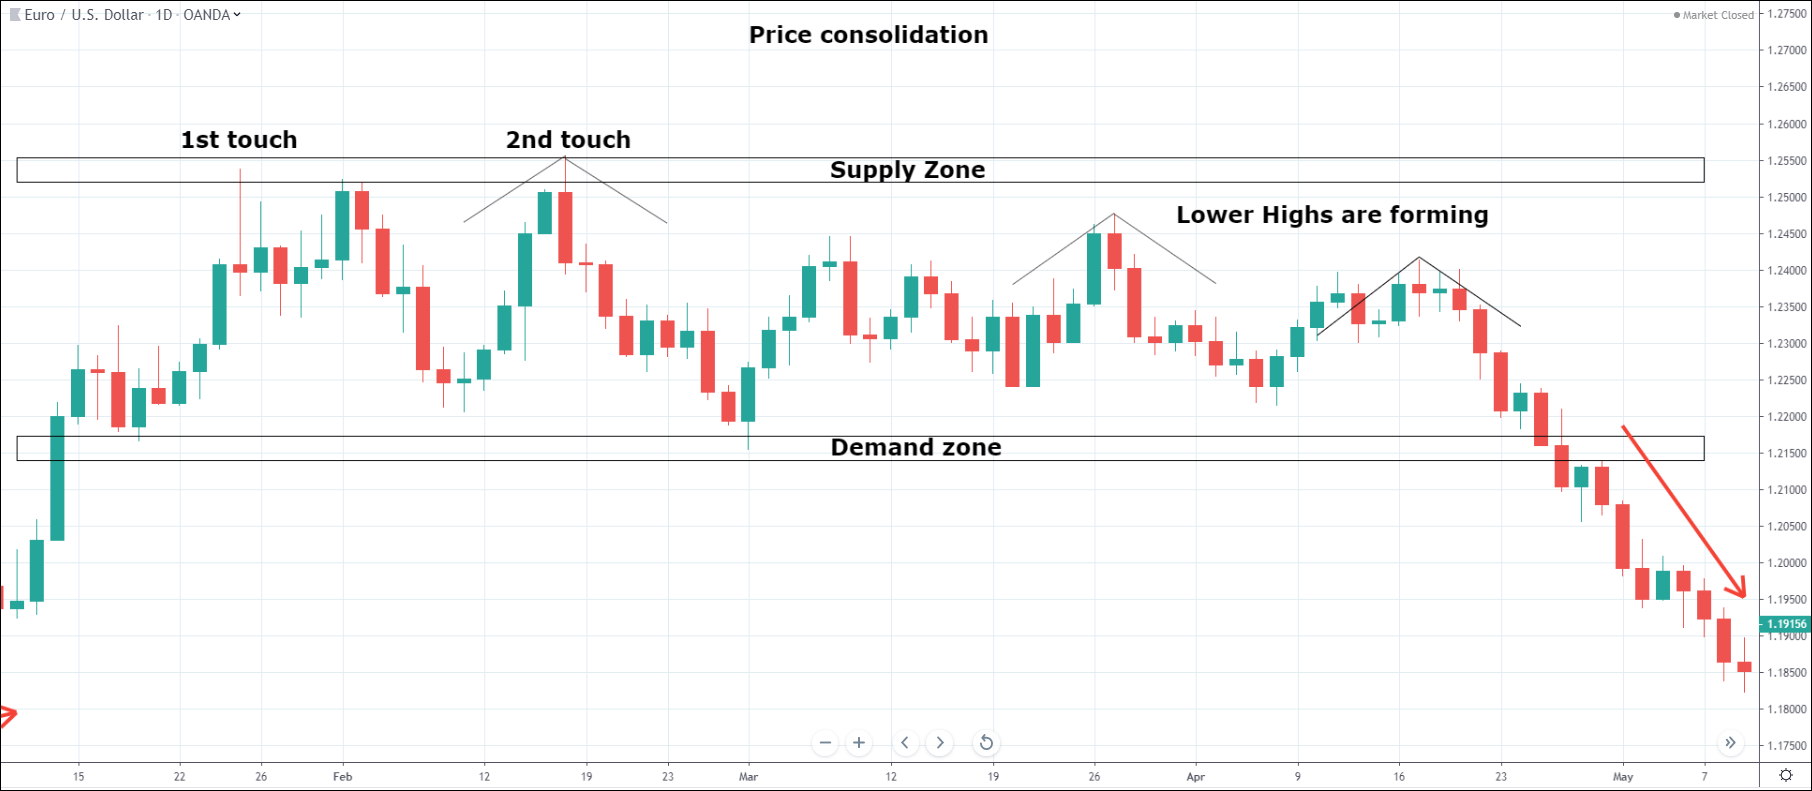
Look at closer picture of the consolidation range below , Price got 2 major rejections at 1st touch and 2nd touch points, which indicates that buying pressure is dying , Also if you look at subsequent peaks starting from 2nd touch point you will see lower highs are forming which also indicates sellers presence , we need to closely look at the demand zone also as once price breaches it we can start putting our sell orders
Note : This is a very basic trade pattern , back testing is highly recommended to master it
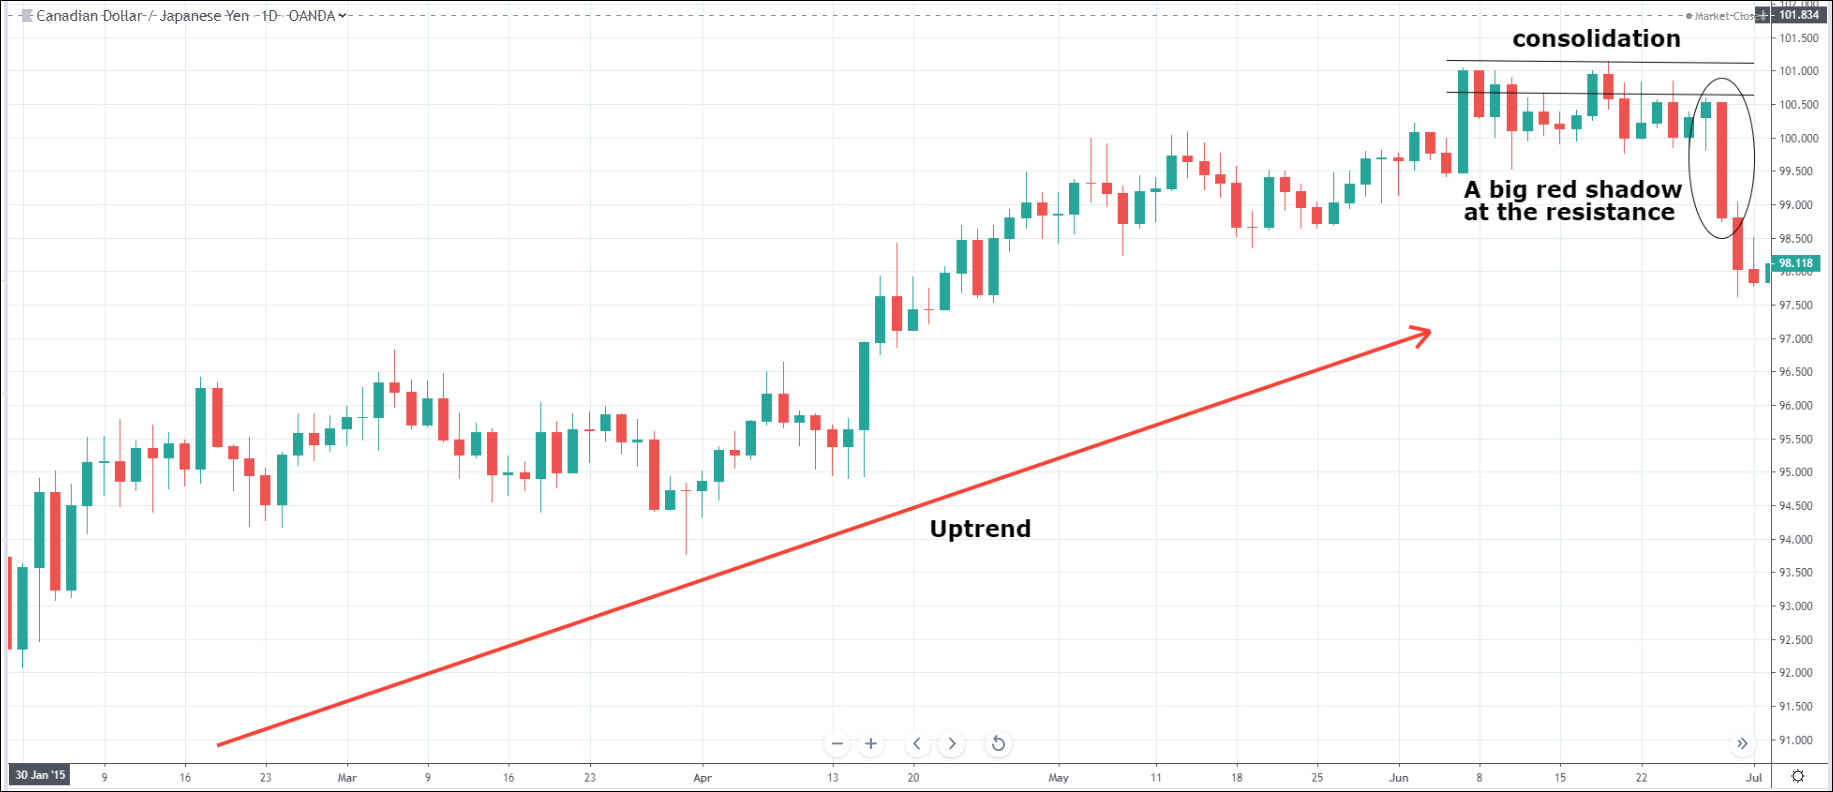
2. The Big Shadow
It is a two candlestick reversal pattern which works very well when they appear on support or resistance zones , lets see how it looks and works
The below encircled candlestick appeared on the resistance zone and its the biggest candlestick in the recent reading sessions , it looks like engulfing candle but its more than that
Some key Points to note
- The Big shadow must print on a zone ( support or resistance)
- Its a two-candlestick pattern which completely dwarfs the first candle
- It is the largest candlestick the market has seen for sometime
- The sell stop signal must be placed few pips below the the big shadow to ensure the the downtrend
- The Stop loss should be kept few pips above the big shadow
Note : Back test and see in which FX pair it works the best
3. Wammies and Moolahs
Market generally takes time to reverse and if you are a naked trader you will always try to find your zones where market rejects or supports price , Wammies and Moolahs tends to appear in these zones , They look very similar to double top and double bottom but they do have very specific character sticks
1.GBPCHF chart below is classic example of a wammie trade setup
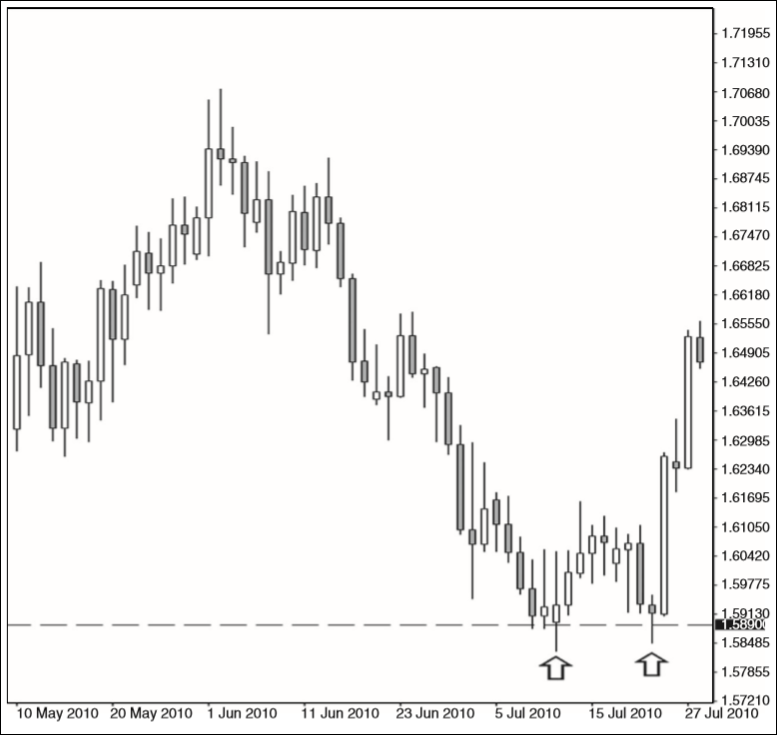
Some points to note when you are trading Wammie and Moolahs
- If the market touches a zone twice in succession , it will often move away from the zone
- Tow touches on a zone from above suggest a market bottom
- when the market makes higher lows , it will often continue upward
- Two touches on a zone from below suggests a market top
- When the market makes lower highs , it will often continue downward
- A bullish candlestick on a support zone suggest that market will trade higher
- A bearish candlestick on a resistance zone suggest that market will trade lower
Note : Moolah is just opposite of a wammie trade
These are some trade setups which i use also they can be elaborated further to get precise entry and exit points , however i have tried to keep the the blog simple to give you a fair idea about these setups . You may write me back and we can discuss more about these trade setups , Till then Take care and stay fit