Hello everyone , How is winter treating you , I have some hot analysis to share with you, to keep you warm and cozy
Here are few observations which is very interesting to share about SPX500 ( US major index)
I have always advised to find trends in the market , and then place your trade in the direction of the trend , if you want to learn more about finding trends Please read my blog here How to find basic trends?
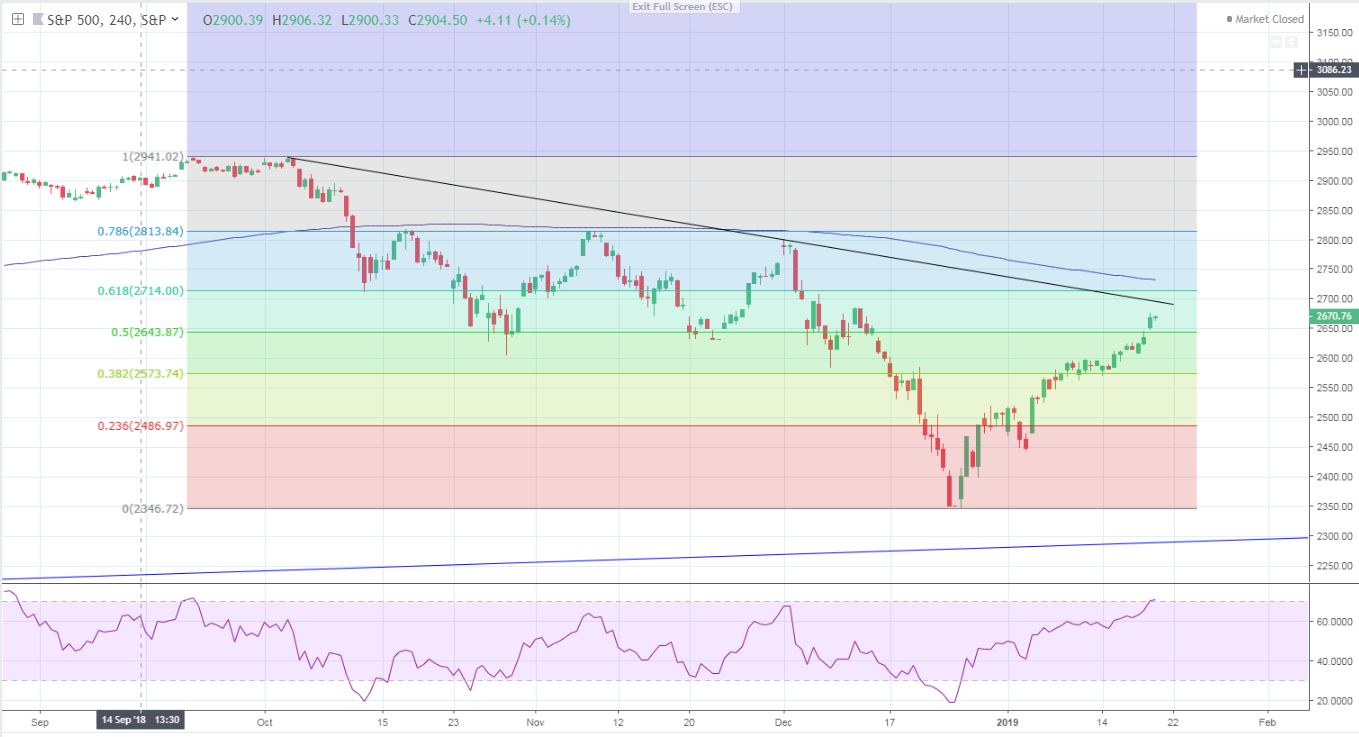
- Spx has dropped a lot , The last peak was at 2940 (all time high) in Sept 2018, it dropped close to 600 points
- The bear trend continues when it started dropping after 50% retracement after reaching close 2680 and then dropped 30 points
- We have analysed this on last Friday to short when market opens on Monday , most of my friends made some non risky bucks out of it
Technical analysis below
- 4 Hour RSI moved above 70 , which Indicates sell signal
- The Price moved above 50% retracement level – which can be a potential sell signal if market news continues to be negative because of trade deal between china and US
- The resistance line in black can be used as great trend line for depicting short term bear trend
- we can continue to make some profits on buy and sell side by using bollinger band with 2% Standard deviation – Sell when the price reaches upper limit of the band and buy when it reaches to the lower limit of the band
Please keep in mind : we still see Bears are dictating the market – Buying at dips can be good strategy , but do not forget to use Stop loss to avoid risk
Invest at your own risk, Stay fit , keep learning