How everyone is doing , I am still enjoying my vacation in india . Now that i have planned to write more often , let me start with the reality , Trading is risky , Very risky . However there are smarter ways of doing this , You have to prepare a plan and follow it . Most people trade what their broker says and what other people says , this the one of the biggest reason why people loose money.
Make a note of the below points before you start trading
- Do not risk all of your money, Risk that much which you can afford to loose
- Practise first before you start trading – read my blog to get started How to start trading ?
- You have to spare time everyday to read stuff , when you are less aware about the market conditions , you tend to place wrong trades – Reading about markets is highly recommended
Lately i was looking at gold prices and i have noticed a pattern which occurs more than 10 times in last five years. Let me show you what i have got.
Lets get started, Please look at the chart below. For sake of simplicity let me first describe you the main components of the chart
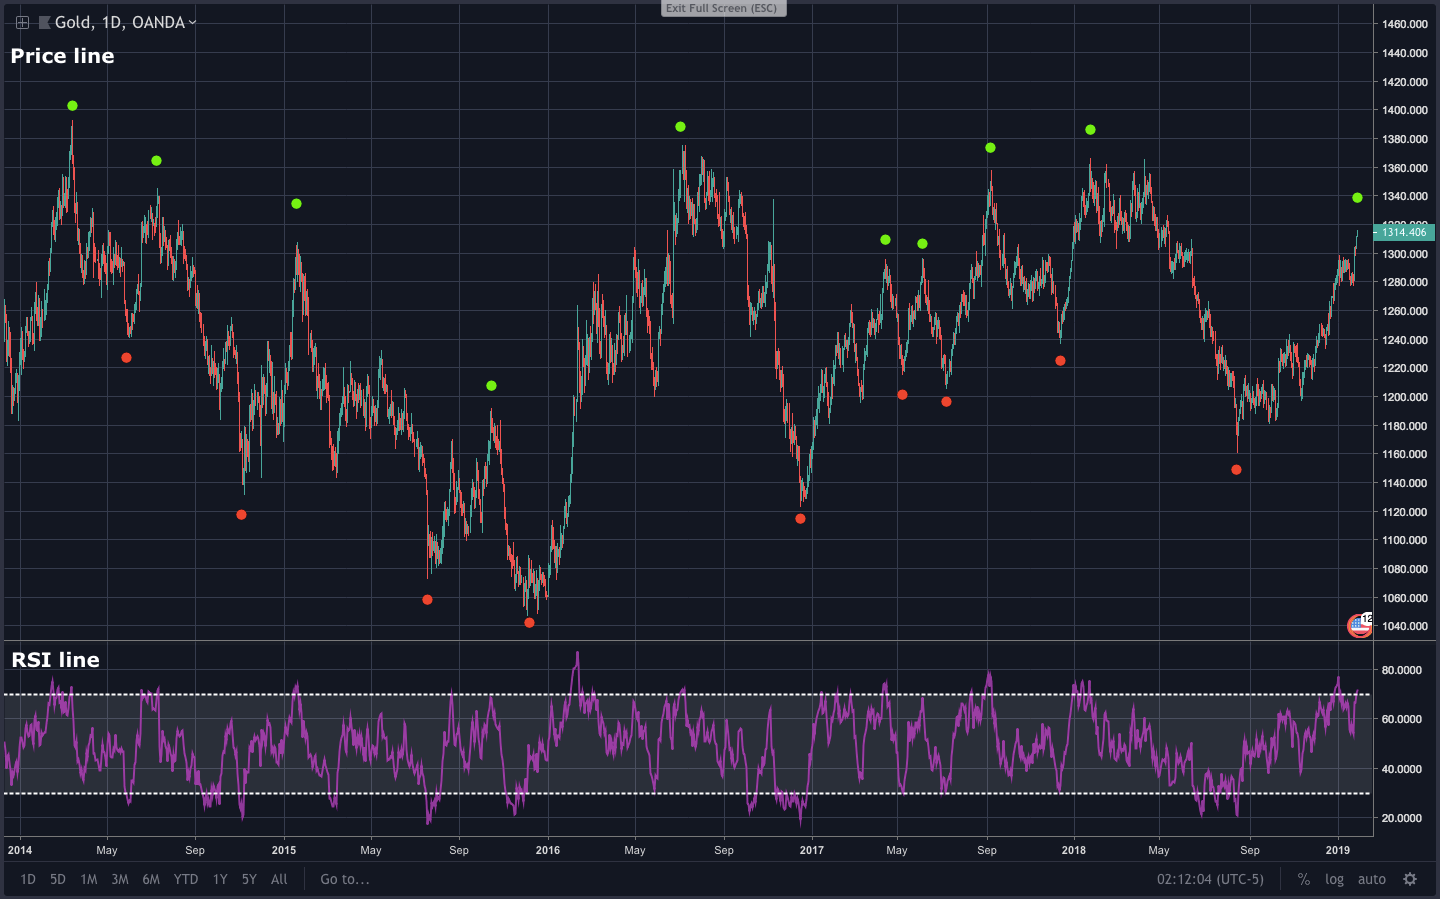
- There are 2 parts of the chart – The upper part is Price line mentioned on the top left side, The lower part is RSI line (Technical indicator) mentioned on the bottom right side in Purple colour
- This is a 5 year chart starting from 2014 to 2019
- Time line is shown at the most bottom of the chart , whereas prices are shown on the right side of the chart
I have made a very precise analysis, which will blow your mind, Take a look at the lil more detailed version of the same chart below , I have added numbers and letters to explain my analysis, Before i dig deep into explaining you let me start with the overview . In the last 5 years prices moved pretty much horizontally , it went up till $1392 in 2014 (Point 1) ,then it went down to $1046 in the end of 2015 ( point D) ,then agin went up and touched $1375 in mid of 2016 ( Point 5) , went down again to 1122 at the end of 2016, In the last five years prices moved in the range of $1392 – $1046 The questions which comes in the mind are
How can we take a benefit of this ?
How do we know when to buy and sell ?
Now lets get deep into this
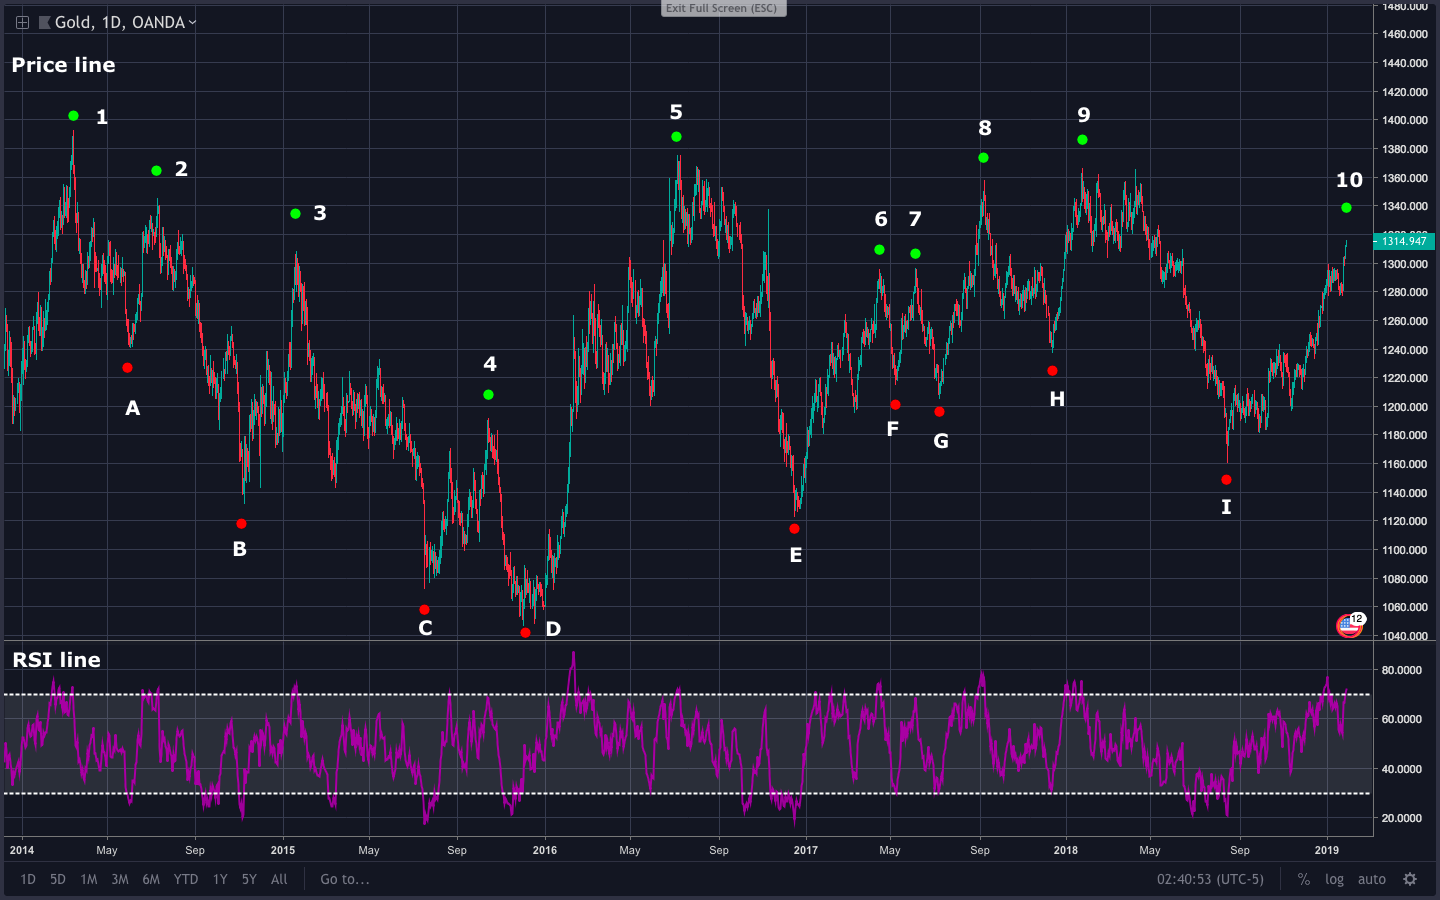 We will use RSI line – Relative strength index in our analysis , It tells us when the stock is overbought and oversold , If the RSI line ( purple colour) crosses above 70% ( upper white dotted line) its called an overbought situation and if it crosses below 30% (lower white dotted line ) then we term it as an oversold situation
TIP : Every time price moved higher and RSI crossed above 70% it tends to go down and vice versa if price moved down and RSI crossed below 30% it tends to go up
Lets discuss point number 1 and A
Price point : $1392 (point 1) , RSI : 74% ( Purple line ) price dropped drastically to $1239 (point A) RSI : 25% .What are we talking here – that if every time RSI line crosses above 70% price will drop – YES THAT IS RIGHT! price dropped 153 Dollars
So we can make plan and place our trade when the time is right
Every time price goes up and RSI goes above 70% Sell IT (why because gold has overbought in the market, price has moved way above and people are getting bearish about it now, Ie prices tends to move down )
Every time price drops and RSI drops below 30% BUY IT (why because gold has oversold in the market, price has moved way below and people are getting bullish about it now ,Ie prices tends to move up )
How many times this has happened in last 5 years – More than 10 times ( i have only marked major price points)
- Points number 1 to 10 shows Selling points , when u see RSI corresponding to those points – it shows greater than 70%
- Points A to I shows buying points , RSI at these points is less than or equal 30%
You can take benefit of the last point number 10 , price has crossed 1314 and trading upwards , RSI has reached 69% i am expecting it will reach 1320 and and then start moving down once Daily RSI crosses above 70% and weekly RSI will touch 70% it will be right time to sell Gold
This was just a small analysis using single technical indicator – RSI, Day trading involves lot of technical analysis , i will continue writing more about it in my coming blogs
Resources
For charts i have used : Trading View
For educational stuff : Forex.com
Note : Trade at your own risk
Take care , stay fit
2 Reply on “The less risky way of trading”